
You may have heard that we’re launching Doltgres 1.0 on August 6th.
As part of the launch, we’ve been improving Doltgres’s performance on Sysbench Latency.
This blog focuses on one of the optimizations we made, specifically focusing on groupby_scan.
Discovering the Optimization#
Doltgres reuses large portions of Dolt and GMS, so it’s not unreasonable to assume that Doltgres should perform similarly to Dolt. Comparing latencies across the different platforms helps us highlight where we are underperforming and where we should focus our attention.
| benchmark | dolt | doltgres | mysql | postgres |
|---|---|---|---|---|
| covering_index_scan | 2.35 | 2.48 | 17.01 | 17.95 |
| groupby_scan | 144.96 | 147.61 | 144.97 | 40.37 |
| index_join | 1.93 | 2.30 | 3.43 | 1.82 |
| index_join_scan | 1.32 | 1.70 | 4.18 | 0.67 |
| index_scan | 219.36 | 493.24 | 350.33 | 179.94 |
| oltp_point_select | 0.25 | 0.39 | 0.19 | 0.15 |
| oltp_read_only | 5.00 | 6.79 | 3.68 | 2.66 |
| select_random_points | 0.52 | 0.80 | 0.36 | 0.22 |
| select_random_ranges | 0.65 | 1.21 | 0.39 | 0.42 |
| table_scan | 207.82 | 475.79 | 350.33 | 179.94 |
| types_table_scan | 458.96 | 1213.57 | 759.88 | 427.07 |
| oltp_delete_insert | 6.21 | 6.91 | 7.70 | 2.22 |
| oltp_insert | 3.19 | 3.89 | 4.10 | 1.10 |
| oltp_read_write | 11.24 | 14.46 | 8.90 | 4.33 |
| oltp_update_index | 3.30 | 3.82 | 4.41 | 1.14 |
| oltp_update_non_index | 3.02 | 3.55 | 4.18 | 1.12 |
| oltp_write_only | 6.32 | 7.43 | 5.18 | 1.79 |
| types_delete_insert | 6.79 | 7.56 | 8.43 | 2.30 |
Focusing on groupby_scan, we see that Postgres is somehow outperforming Dolt, Doltgres, and even MySQL by a significant margin; it’s over 3x faster.
To see what they were doing, I ran EXPLAIN on each of the databases.
Dolt:
sbtest/main*> explain plan SELECT year_col, count(year_col), max(big_int_col), avg(small_int_col) FROM sbtest1 WHERE big_int_col > 0 GROUP BY year_col, set_col ORDER BY year_col;
+---------------------------------------------------------------------------------------------------------------------+
| plan                                                                                                                |
+---------------------------------------------------------------------------------------------------------------------+
| Project                                                                                                             |
|  ├─ columns: [sbtest1.year_col, count(sbtest1.year_col), max(sbtest1.big_int_col), avg(sbtest1.small_int_col)]      |
|  └─ Sort(sbtest1.year_col ASC)                                                                                      |
|      └─ GroupBy                                                                                                     |
|          ├─ select: AVG(sbtest1.small_int_col), COUNT(sbtest1.year_col), MAX(sbtest1.big_int_col), sbtest1.year_col |
|          ├─ group: sbtest1.year_col, sbtest1.set_col                                                                |
|          └─ IndexedTableAccess(sbtest1)                                                                             |
|              ├─ index: [sbtest1.big_int_col]                                                                        |
|              ├─ filters: [{(0, ∞)}]                                                                                 |
|              └─ columns: [small_int_col big_int_col set_col year_col]                                               |
+---------------------------------------------------------------------------------------------------------------------+
10 rows in set (0.00 sec)
Doltgres:
postgres=> explain SELECT year_col, count(year_col), max(big_int_col), avg(small_int_col) FROM sbtest1 WHERE big_int_col < 0 GROUP BY year_col, set_col ORDER BY year_col;
                                                                 plan
---------------------------------------------------------------------------------------------------------------------------------------
 Project
  ├─ columns: [sbtest1.year_col, count(sbtest1.year_col) as count, max(sbtest1.big_int_col) as max, avg(sbtest1.small_int_col) as avg]
  └─ Sort(sbtest1.year_col ASC)
      └─ GroupBy
          ├─ select: COUNT(sbtest1.year_col), MAX(sbtest1.big_int_col), avg(sbtest1.small_int_col), sbtest1.year_col
          ├─ group: sbtest1.year_col, sbtest1.set_col
          └─ IndexedTableAccess(sbtest1)
              ├─ index: [sbtest1.big_int_col]
              ├─ filters: [{(NULL, 0)}]
              └─ columns: [small_int_col big_int_col set_col year_col]
MySQL:
mysql> explain analyze SELECT year_col, count(year_col), max(big_int_col), avg(small_int_col) FROM sbtest1 WHERE big_int_col > 0 GROUP BY year_col, set_col ORDER BY year_col;
+----------------------------------------------------------------------------------------------------------------------------------------------------------------------------+
| EXPLAIN                                                                                                                                                                    |
+----------------------------------------------------------------------------------------------------------------------------------------------------------------------------+
| -> Sort: sbtest1.year_col, sbtest1.set_col  (actual time=16.4..16.4 rows=765 loops=1)
    -> Table scan on <temporary>  (actual time=15.9..16.1 rows=765 loops=1)
        -> Aggregate using temporary table  (actual time=15.9..15.9 rows=765 loops=1)
            -> Filter: (sbtest1.big_int_col > 0)  (cost=995 rows=4896) (actual time=0.222..7.37 rows=4896 loops=1)
                -> Table scan on sbtest1  (cost=995 rows=9707) (actual time=0.219..6.36 rows=10000 loops=1)
 |
+----------------------------------------------------------------------------------------------------------------------------------------------------------------------------+
1 row in set (0.02 sec)
Postgres:
postgres=# explain analyze SELECT year_col, count(year_col), max(big_int_col), avg(small_int_col) FROM sbtest1 WHERE big_int_col < 0 GROUP BY year_col, set_col ORDER BY year_col;
                                                      QUERY PLAN
----------------------------------------------------------------------------------------------------------------------
 Sort  (cost=427.98..429.89 rows=765 width=55) (actual time=6.003..6.057 rows=765 loops=1)
   Sort Key: year_col
   Sort Method: quicksort  Memory: 84kB
   ->  HashAggregate  (cost=381.77..391.34 rows=765 width=55) (actual time=5.183..5.672 rows=765 loops=1)
         Group Key: year_col, set_col
         Batches: 1  Memory Usage: 297kB
         ->  Seq Scan on sbtest1  (cost=0.00..318.00 rows=5102 width=17) (actual time=0.005..2.315 rows=5104 loops=1)
               Filter: (big_int_col < 0)
               Rows Removed by Filter: 4896
 Planning Time: 0.711 ms
 Execution Time: 6.327 ms
(11 rows)
Interesting, Dolt and Doltgres are using the secondary index defined over big_int_col, while MySQL and Postgres just perform a full table scan.
Since the values in big_int_col are uniformly distributed around 0, the filter where big_int_col > 0 excludes roughly half the columns.
It appears the MySQL and Postgres analyzer is smart enough to recognize that the additional lookup is suboptimal.
The flame graph supports this conclusion.
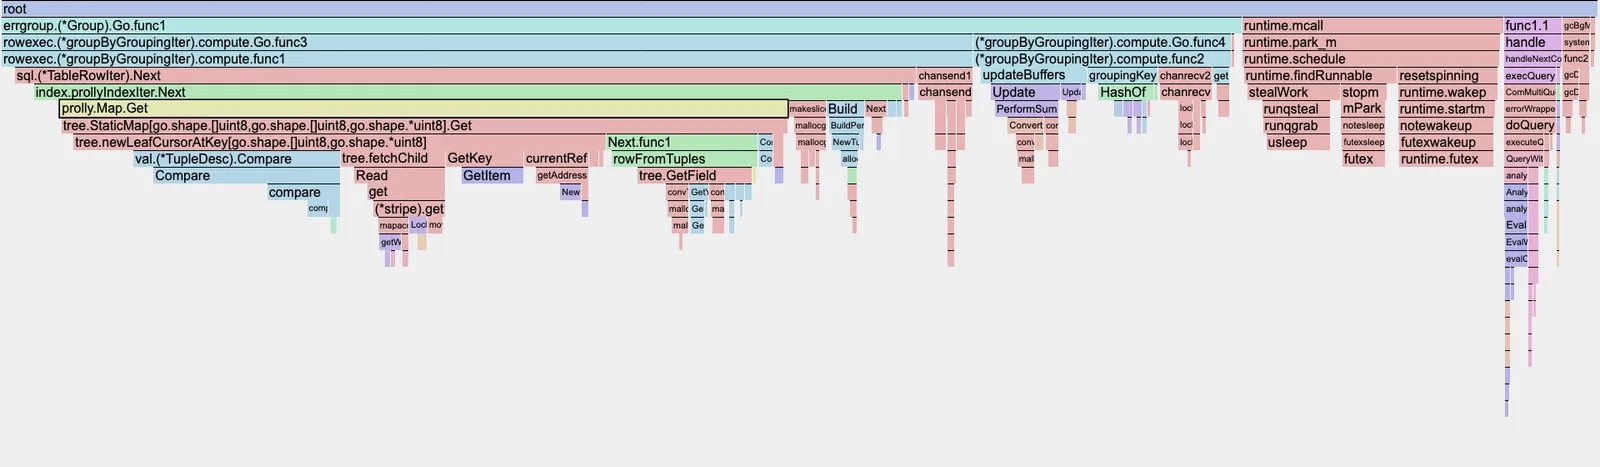
Here, we see that a large portion of the CPU is spent in prolly.Map.Get, which is the secondary key lookup.
Optimization#
Currently, our analyzer will always pick an index when applicable because we assume that will always be better. Evidently, we have discovered that isn’t always the case. We need to modify the existing coster to consider full table scans depending on how well the index filters the results. Fortunately, we implemented statistics a while ago, and we can use the histograms there to get a good estimate of how selective the filter is.
We added these new heuristics to the coster:
- A primary key is always better than no index
- A secondary index should only be used over a full table scan if it selects fewer than 25% of rows
- A covering index is always better than no index
The rest of the coster remains the same. In the future, we should take into consideration things like the complexity of the filter, if the table can fit into memory, size of output row, etc., but this is good enough for now. If you’d like to read the implementation in greater detail, you can check out these PRs:
However, it took some extra work to carry these performance benefits over to Doltgres. While Doltgres does use the same costing logic, statistics weren’t even enabled. After enabling statistics, fixing some bugs, and adding some logic to get histograms working, these are the results:
| benchmark | dolt | doltgres | mysql | postgres |
|---|---|---|---|---|
| covering_index_scan | 2.35 | 2.43 | 17.01 | 17.95 |
| groupby_scan | 62.19 | 82.96 | 144.97 | 40.37 |
| index_join | 1.93 | 2.30 | 3.43 | 1.82 |
| index_join_scan | 1.32 | 1.67 | 4.18 | 0.67 |
| index_scan | 204.11 | 484.44 | 350.33 | 179.94 |
| oltp_point_select | 0.25 | 0.40 | 0.19 | 0.15 |
| oltp_read_only | 4.91 | 6.55 | 3.68 | 2.66 |
| select_random_points | 0.52 | 0.74 | 0.36 | 0.22 |
| select_random_ranges | 0.65 | 1.04 | 0.39 | 0.42 |
| table_scan | 204.47 | 475.79 | 350.33 | 179.94 |
| types_table_scan | 458.96 | 1213.57 | 759.88 | 427.07 |
| oltp_delete_insert | 6.21 | 6.79 | 7.70 | 2.22 |
| oltp_insert | 3.19 | 3.89 | 4.10 | 1.10 |
| oltp_read_write | 11.24 | 14.21 | 8.90 | 4.33 |
| oltp_update_index | 3.30 | 3.82 | 4.41 | 1.14 |
| oltp_update_non_index | 3.02 | 3.49 | 4.18 | 1.12 |
| oltp_write_only | 6.32 | 7.30 | 5.18 | 1.79 |
| types_delete_insert | 6.79 | 7.43 | 8.43 | 2.30 |
On Dolt, this brought down the latency for groupby_scan from 144.96ms to 62.19ms; this is a 57.1% improvement!
On Doltgres, groupby_scan latency decreased from 147.61ms to 82.96ms, which is a 43.80% improvement.
With these optimizations, Dolt’s latency for groupby_scan is less than half of MySQL’s.
Unfortunately, Postgres still pulls way ahead with their latency being less than half that of Doltgres’s.
While we were focused on groupby_scan, there were also some improvements to index_scan.
Dolt went from 219.36ms down to 204.11ms, which is a 6.95% improvement.
Doltgres went from 493.24ms down to 484.44ms, which is a 1.78% improvement.
Interestingly, a byproduct of this optimization is that the index_scan and table_scan benchmarks are essentially the same now.
The resulting plans from both these queries avoid the secondary index, making them both full table scans with a filter.
Conclusion#
We continue to bring performance improvements to both Dolt and Doltgres.
Making our coster just a little bit smarter has resulted in our groupby_scan benchmarks running two times faster.
Stay tuned to hear more about the performance improvements included in the upcoming Doltgres 1.0 release!
Feel free to chat with us on Discord or file a Github issue.