Dolt is the first version controlled database with Git semantics. We often compare ourselves to MySQL because that was the first wire protocol we achieved drop-in compatibility with. But , with the release of Doltgres, we also have a Postgres-compatible version of Dolt. We strive to be many things, including as fast as established relational databases.
We recently shipped some changes intended to speed up small range reads. The specific changes include:
-
Skipping filter nodes when index lookups are exact.
-
Use a callback-less leaf node iterator when range reads are contiguous.
-
Avoiding deserializing rows when only performing a count.
These changes improved small range reads, but they also accidentally made an aggregation test
a lot faster. The table below shows a comparison of MySQL at version
8.0.35 with latency 2.07ms, and Dolt 1.42.17 with latency .65ms:

We went from being 1.3x slower than MySQL to 70% faster! We will dig into why and what we learned from this.
covering_index_scan#
The specific query reads and counts a fraction of an index:
sbtest/main*> explain select count(id) from sbtest1 where big_int_col > 0;
+--------------------------------------------------------------------------+
| plan                                                                     |
+--------------------------------------------------------------------------+
| Project                                                                  |
|  ├─ columns: [count(sbtest1.id)]                                         |
|  └─ GroupBy                                                              |
|      ├─ SelectedExprs(COUNT(sbtest1.id))                                 |
|      ├─ Grouping()                                                       |
|      └─ IndexedTableAccess(sbtest1)                                      |
|          ├─ index: [sbtest1.big_int_col,sbtest1.tiny_int_col,sbtest1.id] |
|          ├─ filters: [{(0, ∞), [NULL, ∞), [NULL, ∞)}]                    |
|          └─ columns: [id big_int_col]                                    |
+--------------------------------------------------------------------------+
This scan is called “covering” because we have access to all projected rows from the secondary index. This is as opposed to a “noncovering” access that has to jump from secondary to primary to backfill fields.
But (count(id) does not really project any rows. id is the only
column with a variable reference, and count just checks whether or not
a reference is null, which in Dolt’s storage format does not require deserialization.

So “why Dolt is faster” is fairly easy — our execution plan does almost
as little work as is possible for this query. We read a contiguous set
of leaf pages and count the number of rows with non-nil id fields.
We could technically make this faster — id is a non-NULL field, so we
could use prolly internal node subtree counts to skip actually reading
individual rows and even reading leaf nodes in some cases.
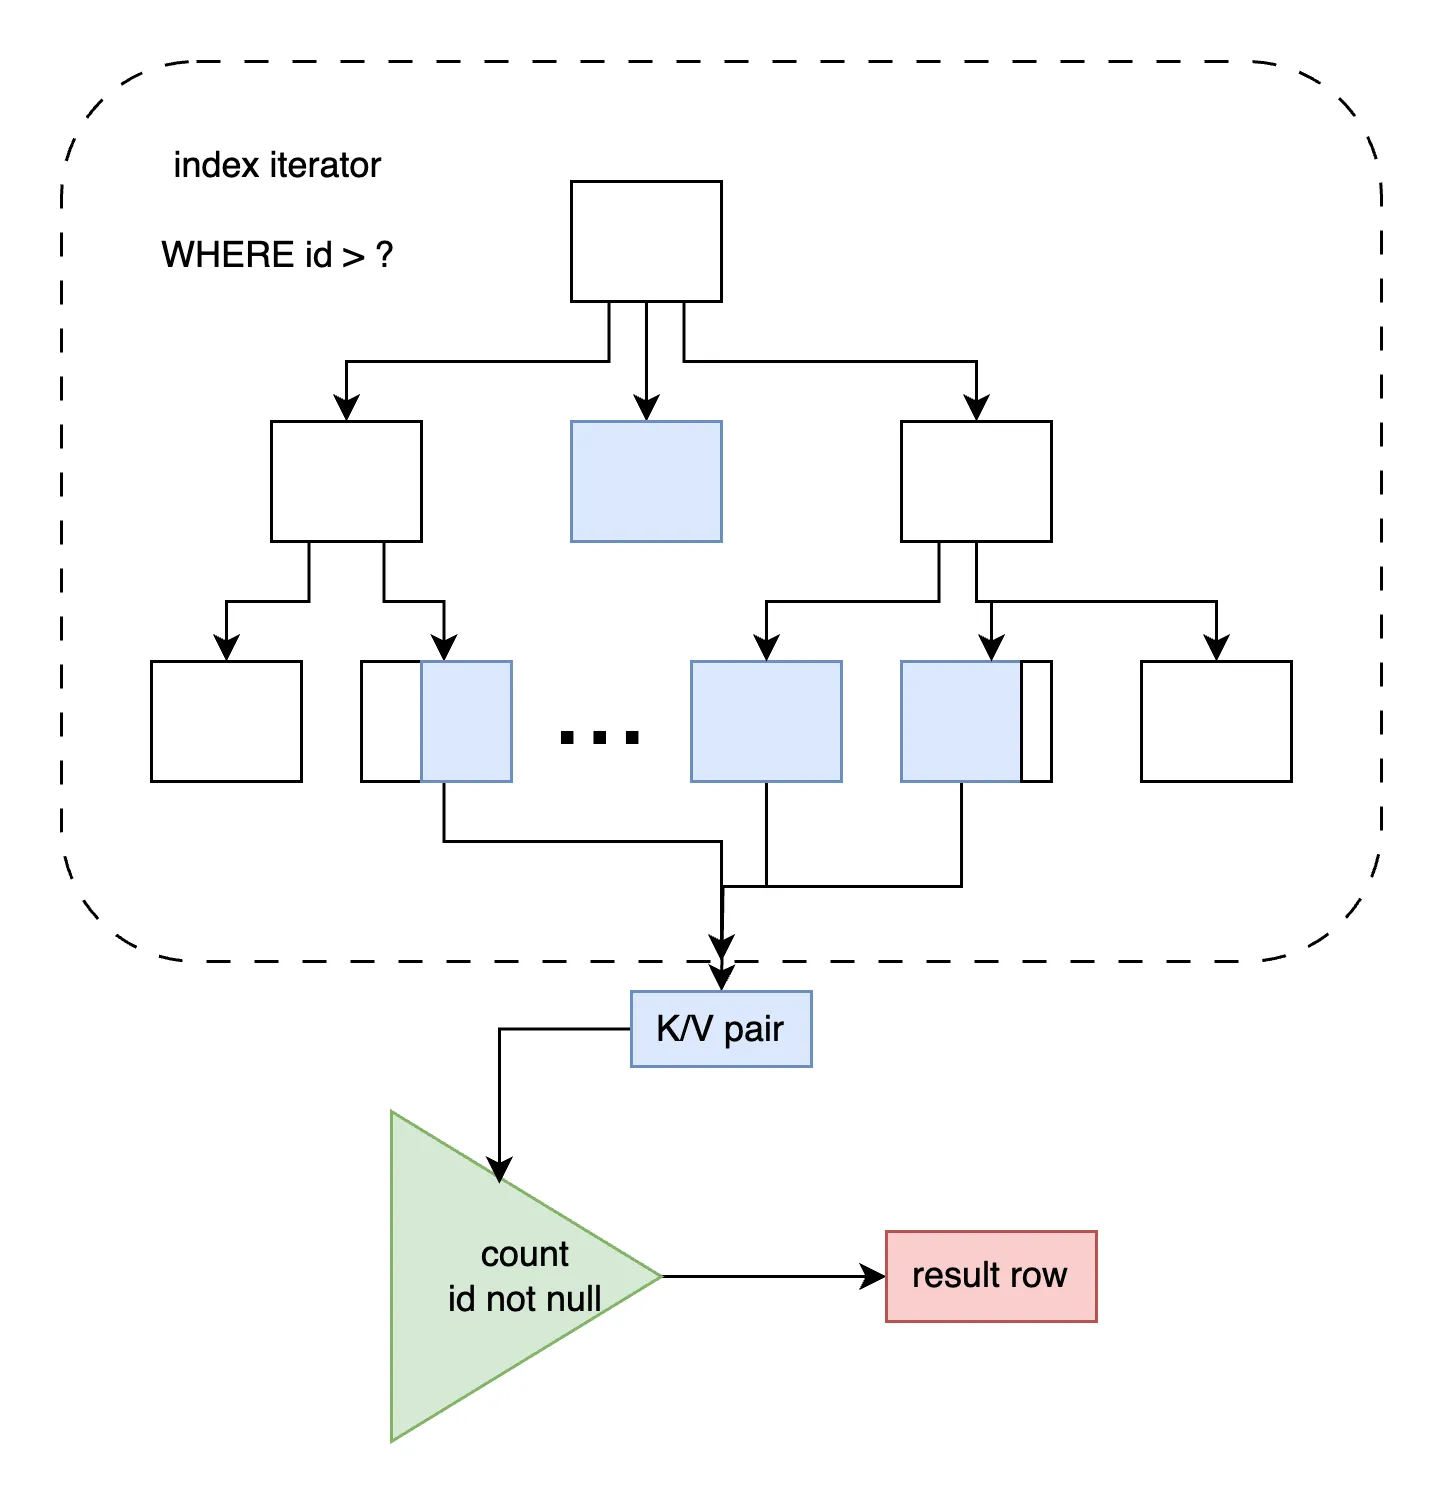
For example, in the diagram above we could skip reading the blue level 2
intermediate node’s children, because the node carries a .subtreeCount
field that will equal the number of enclosed rows.
An index scan would only have to descend into leaf
checks for boundary keys that lie between internal node boundaries.
Given the analysis at the end of this blog, that faster version would
probably be another 25% faster (.40ms), about 80% faster than MySQL.
To put it all into perspective, a unit of useful work will usually involve multiple queries between a client and server. Each iteration within a datacenter will have a round-trip time (RTT) on the order of 100 milliseconds. And we are discussing 2ms versus 650 microseconds to actually execute the query. Every microsecond counts, but practically speaking end-users will experience the same performance between MySQL and Dolt.
Comparing To MySQL#
Trying to squeeze more performance out of an arguably edge-case query is less interesting than taking the opportunity to understand MySQL better. So far my perf work has borrowed from database theory broadly but in practice only sampled Dolt’s execution, either CPU/memory or tracing profiles. Today, we’ll profile MySQL’s execution as well.
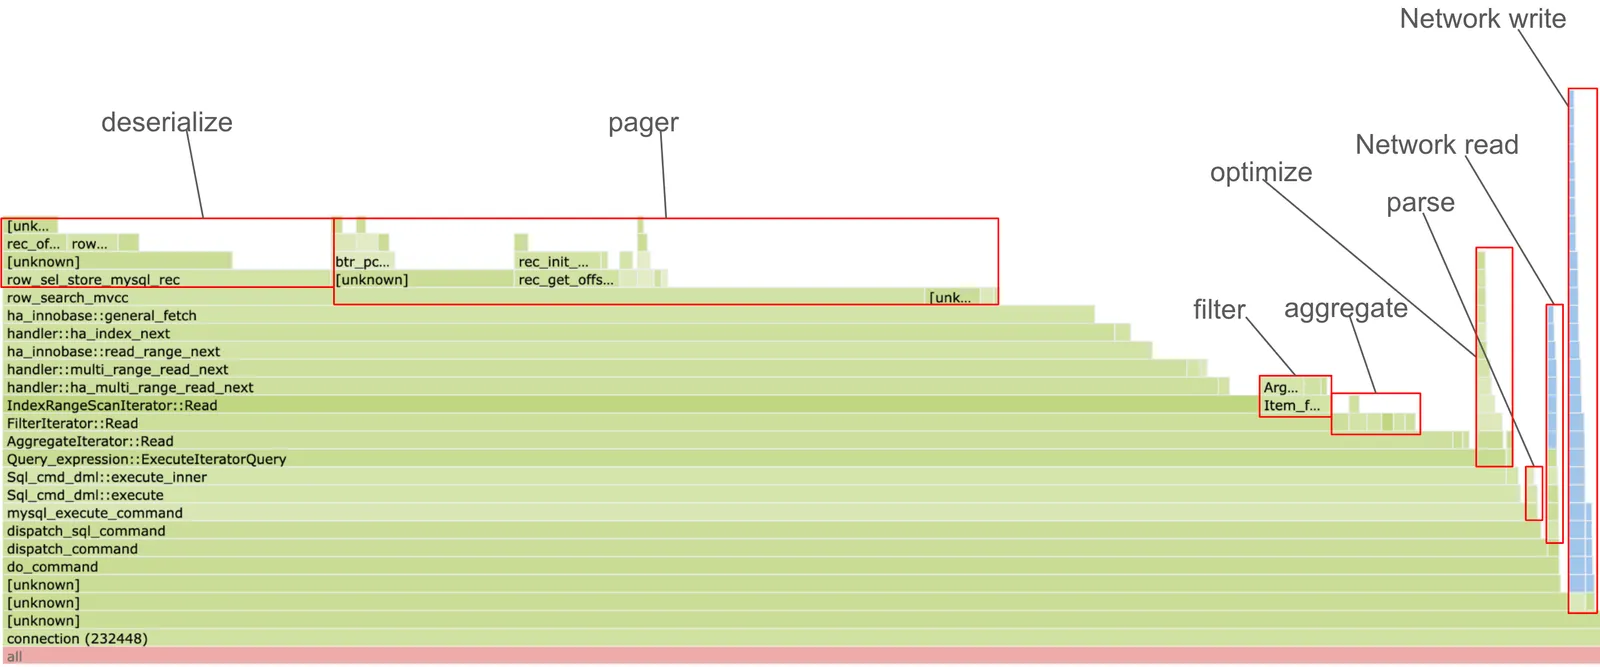
We used the perf tool to collect CPU profiles for MySQL and Dolt
running the covering_index_scan sysbench script. Here is an overview
trace for MySQL:

The query runs in about 2ms (without profiling). About 8% of that time is spent parsing, optimizing, and transmitting data over the network. We will come back to that, but first let’s look at the 92% of CPU time spent in execution:
   - 92.03% Query_expression::ExecuteIteratorQuery
      - 90.49% AggregateIterator::Read
         - 83.99% FilterIterator::Read
            - 78.40% IndexRangeScanIterator::Read
               - 75.83% handler::ha_multi_range_read_next
                  - 73.86% handler::multi_range_read_next
                     - 71.72% ha_innobase::read_range_next
                        - 69.36% handler::ha_index_next
                           - 68.14% ha_innobase::general_fetch
                              - 57.53% row_search_mvcc
                                 + 20.55% row_sel_store_mysql_rec
This is a volcano iterator stack. Each Read
performs some processing logic on a global row reference updated by
descending child iterators.
We labeled components in the flamegraph, but we comment on
a few more more notable steps below.
AggregateIterator spends 2.27% of the time in the
volcano call function, and around ~4% of the time calling functions related
to comparison (Iter_func_ft::val_int), summing (Item_sum_count::add)
and null checks (Aggregator_simple::arg_is_null). I’ll assume most of the
other line items relate to aggregation data structures. And then the
child iterator absorbs the other 84% of CPU time.
-   90.49%     2.27%  connection       mysqld                      [.] AggregateIterator::Read
   - 88.22% AggregateIterator::Read
      + 83.99% FilterIterator::Read
      + 1.12% Item_sum_count::add
        0.95% Item_func_gt::val_int
        0.74% IndexRangeScanIterator::Read
        0.72% update_item_cache_if_changed
        0.65% Aggregator_simple::arg_is_null
   + 2.27% 0x708be5e94ac3
The FilterIterator spends 1.37% of the time as the deepest function in
the callstack, 4.45% of the time calling a comparison function, and then
78% of the time in the IndexRangeScanIterator.
-   84.39%     1.37%  connection       mysqld                      [.] FilterIterator::Read
   - 83.02% FilterIterator::Read
      + 78.40% IndexRangeScanIterator::Read
      + 4.45% Item_func_gt::val_int
   + 1.37% 0x708be5e94ac3
The intermediate stack call before row_search_mvcc absorb 10% of the
runtime but doesn’t appear to do anything particularly interesting.
row_search_mvcc, on the other hand, appears to walk, lock, buffer, and
deserialize B-Tree pages searching for key matches.
-   57.77%    15.78%  connection       mysqld                      [.] row_search_mvcc
   - 41.99% row_search_mvcc
      + 20.56%
      + 6.60% rec_get_offsets
      + 3.99% 0x5b4d76e82607
        1.18% 0x5b4d76795dd8
      + 1.14% btr_pcur_t::store_position
      + 1.05% mtr_t::commit
        0.59% 0x5b4d767c1953
        0.51% 0x5b4d767be63c
   + 15.78% 0x708be5e94ac3
The detail we do care about is the time spent paging (~37% of CPU time
in row_search_mvcc and helpers) vs deserializing pages (~20% of CPU time in row_sel_store_mysql_rec).
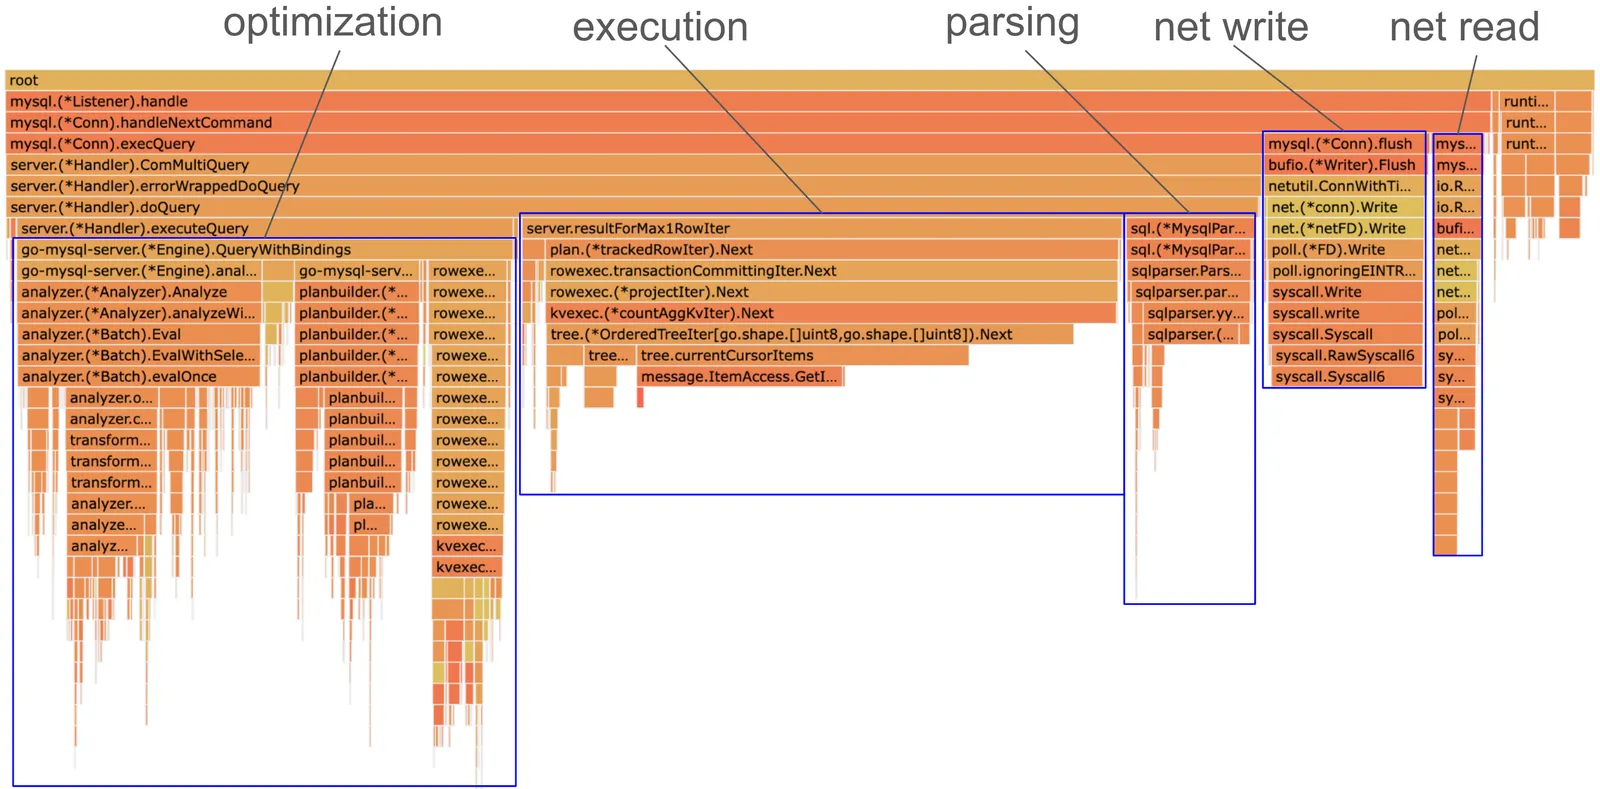
The Dolt-side execution (35% of CPU time) is a bit simpler because it is all paging, no deserialization:
-   35.01%     1.00%  dolt     dolt               [.] github.com/dolthub/dolt/go/libraries/doltcore/sqle/kvexec.(*countAggKvIter).Next
   + 34.00% github.com/dolthub/dolt/go/libraries/doltcore/sqle/kvexec.(*countAggKvIter).Next
   - 1.00% runtime.goexit.abi0
        github.com/dolthub/vitess/go/mysql.(*Listener).Accept.gowrap1
        github.com/dolthub/vitess/go/mysql.(*Listener).handle
        github.com/dolthub/vitess/go/mysql.(*Conn).handleNextCommand
        github.com/dolthub/vitess/go/mysql.(*Conn).execQuery
        github.com/dolthub/go-mysql-server/server.(*Handler).ComMultiQuery
        github.com/dolthub/go-mysql-server/server.(*Handler).errorWrappedDoQuery
        github.com/dolthub/go-mysql-server/server.(*Handler).doQuery
        github.com/dolthub/go-mysql-server/server.resultForMax1RowIter
        github.com/dolthub/go-mysql-server/sql/plan.(*trackedRowIter).Next
        github.com/dolthub/go-mysql-server/sql/rowexec.(*transactionCommittingIter).Next
        github.com/dolthub/go-mysql-server/sql/rowexec.(*projectIter).Next
        github.com/dolthub/dolt/go/libraries/doltcore/sqle/kvexec.(*countAggKvIter).Next
Here is the full breakdown of the Dolt side, for thouroughness:

We have highlighted network, parsing, and analysis sections. Note that dolt optimization is broken into (1) binding, (2) optimization rules, and (3) execution iterator building.
Slower Than MySQL?#
That was a lot of details, but what actually matters?
Parsing, optimization, and flushing take .42ms in Dolt, compared to .17ms in MySQL. Each component is about twice as slow in Dolt.
Deserialization is up to 4x slower in Dolt: 1.7ms vs .40ms in MySQL.
We say “up to” because this metric muddles a three different features of
the kviter version:
(1) we flatten the callstack (which was ~10% in MySQL), (2) we use less general purpose data
structures (fewer lists/map allocations), and (3) we skip formatting serialized fields
into the presentation row format. Number (3) is the thing we care about, which we discussed
more in-depth in my last blog.
Paging before optimizations was about the same as MySQL: .56ms + .23ms = .80ms vs .75ms is Dolt. And Dolt afterwards is faster: .23ms vs .75ms. It is important to note that this is all in-memory, while our TPC-C metrics include the effect of more parameters like I/O, compression, and cache consistency.
| Stage | MySQL | Dolt |
|---|---|---|
| Parsing, optimization, flushing | .17ms | .42ms |
| Deserialization | .4ms | 1.7ms |
| Paging | .75ms | .23ms |
Dolt’s slower analysis and faster paging are related. Dolt’s query initialization is expensive partly because we lookup immutable table root nodes. This is slower than using a single common B-Tree, but makes execution paging much simpler.
But our deserialization speed seems worse perhaps without tradeoffs. That seems like an area worthy of more investigation.
Summary#
It is fun to start beating MySQL on
benchmarks. covering_index_scan does not have the most generalizable
perf changes, but we have learned a lot comparing Dolt and MySQL’s
perf profiles. We will work on trying to narrow our analysis perf gaps,
lean into our execution advantages, and look into expanding on kviter’s deserialization benefits.
Hopefully we will be back with more perf wins soon.
If you have any questions about Dolt, databases, or Golang performance reach out to us on Twitter, Discord, and GitHub!