Dolt reached production quality as a relational database about a year ago. We started more seriously testing Dolt against TPC-C beforehand in anticipation of more contentious transactional workloads. Dolt aims to be around 2-3x compared to MySQL on all performance benchmarks. We are faster but still a bit off the target at 4-5x MySQL’s TPC-C performance compared to ~8x MySQL last year. Today we report updates on how we have doubled out single thread TPC-C throughput in the last year and where we are headed next.
TPC-C Background#
TPC-C is a standard transactional benchmark for measuring database throughput and scalability. The benchmark models a warehousing business as a closed loop system where a fixed set of workers manage purchase cycles. Here is what one of those cycle looks like:
SELECT c_discount, c_last, c_credit, w_tax FROM customer2, warehouse2 WHERE w_id = 1 AND c_w_id = w_id AND c_d_id = 9 AND c_id = 2151;
SELECT d_next_o_id, d_tax FROM district2 WHERE d_w_id = 1 AND d_id = 9 FOR UPDATE;
UPDATE district2 SET d_next_o_id = 3002 WHERE d_id = 9 AND d_w_id= 1;
INSERT INTO orders2 (o_id, o_d_id, o_w_id, o_c_id, o_entry_d, o_ol_cnt, o_all_local) VALUES (3001,9,1,2151,NOW(),12,1);
INSERT INTO new_orders2 (no_o_id, no_d_id, no_w_id) VALUES (3001,9,1);
SELECT i_price, i_name, i_data FROM item2 WHERE i_id = 2532;
SELECT s_quantity, s_data, s_dist_09 s_dist FROM stock2 WHERE s_i_id = 2532 AND s_w_id= 1 FOR UPDATE;
UPDATE stock2 SET s_quantity = 39 WHERE s_i_id = 2532 AND s_w_id= 1;
INSERT INTO order_line2 (ol_o_id, ol_d_id, ol_w_id, ol_number, ol_i_id, ol_supply_w_id, ol_quantity, ol_amount, ol_dist_info) VALUES (3001,9,1,1,2532,1,5,301,'kkkkkkkkkkkkkkkkkkkkkkkk');
The purchase starts with retrieving a customer’s contact and financials.
We update the latest district order, add the purchase to orders and
new_orders. After updating stock counts to reflect the inventory
change, we
queue the order with the customer, order, and item ids collected
throughout the purchase. If we’re lucky the transaction lands without
conflicts. Otherwise the client needs to retry with new values to
preserve the consistency of our bookkeeping.
The customer and order keys are randomized to allow an arbitrary number of clients to run concurrently indefinitely. The fixed set of workers compete with each other for landing updates in this concurrent environment. The database and client parameters let us stress test at scale.
TPC-C is considered a standard because it is a wholistic and scalable stress test that most database systems report. In addition to testing ACID properties, TPC-C can test concurrency, partitioning, caching, and failover response.
TPC-C is not a one-stop shop for all workloads. For example, it does not test open-ended systems with unbounded queues. The client’s narrow read/write scopes support easy partitioning and horizontal scaling. But in contrast to sysbench, which runs single queries in a loop, TPC-C forms an important component for testing a well-rounded database.
Perf Improvements#
Dolt 1.0#
We will first recap the last update. The new storage format made two changes. Rather than storing a full schema with every row, a table now stores the schema only once. Additionally, fixed access reads avoid deserializing full rows when only accessing single fields. The improvements dramatically improved read and write performance,
We also added a write-ahead chunk journal that avoids creating new files for every write, boosting write performance even more.
Engine improvements#
Over the last year we started working on the individual queries skewing tail latency referenced in the last update. In the most recent minor release (1.35.0), the CPU profiles are dominated by IO syscalls.
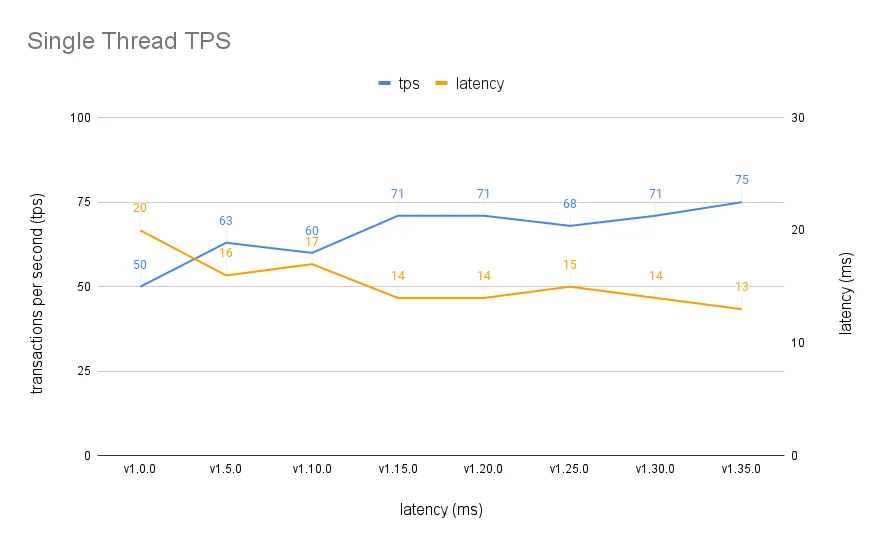
The result is a better throughput (50tps->75tps) and latency (20ms->13ms) with a single client:

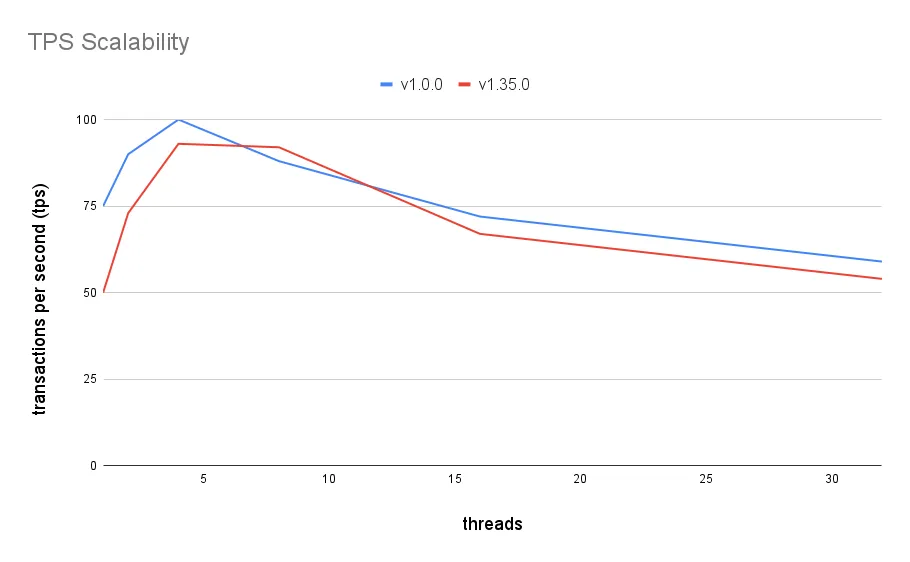
Although the difference still narrows under high concurrency:

We will mention a few of the biggest engine side changes that contributed to this performance.
Name resolution#
Performing name resolution/binding before transformation rules fixed many correctness errors but also let us delete a lot of code. Most queries only run two or three of the previous ~50 rules now, because we inline the ones that matter in the appropriate constructors.
Projection improvements#
Projection pruning is a thing we have talked about before, but some edge cases slipped through in TPC-C queries. Tables with blob columns that are expensive to deserialize are damaging to tail latency when unnecessary:
sbt> explain SELECT c_id FROM customer1 WHERE c_w_id = 1 AND c_d_id= 5 AND c_last='ESEEINGABLE' ORDER BY c_first;
+-------------------------------------------------------------------------------------------------------------------------------------------------------------------------------------------------------------------------------+
| plan                                                                                                                                                                                                                          |
+-------------------------------------------------------------------------------------------------------------------------------------------------------------------------------------------------------------------------------+
| Project                                                                                                                                                                                                                       |
|  ├─ columns: [customer1.c_id]                                                                                                                                                                                                 |
|  └─ Sort(customer1.c_first ASC)                                                                                                                                                                                               |
|      └─ Filter                                                                                                                                                                                                                |
|          ├─ (customer1.c_last = 'ESEEINGABLE')                                                                                                                                                                                |
|          └─ IndexedTableAccess(customer1)                                                                                                                                                                                     |
|              ├─ index: [customer1.c_w_id,customer1.c_d_id,customer1.c_id]                                                                                                                                                     |
|              ├─ filters: [{[1, 1], [5, 5], [NULL, ∞)}]                                                                                                                                                                        |
|              └─ columns: [c_id c_d_id c_w_id c_first c_middle c_last c_street_1 c_street_2 c_city c_state c_zip c_phone c_since c_credit c_credit_lim c_discount c_balance c_ytd_payment c_payment_cnt c_delivery_cnt c_data] |
+-------------------------------------------------------------------------------------------------------------------------------------------------------------------------------------------------------------------------------+
c_data is not a field we needed to read off disk, so pruning that
column improved this query’s latency from ~100ms down to ~5ms:
+---------------------------------------------------------------------------+
| plan                                                                      |
+---------------------------------------------------------------------------+
| Project                                                                   |
|  ├─ columns: [customer1.c_id]                                             |
|  └─ Sort(customer1.c_first ASC)                                           |
|      └─ Filter                                                            |
|          ├─ (customer1.c_last = 'ESEEINGABLE')                            |
|          └─ IndexedTableAccess(customer1)                                 |
|              ├─ index: [customer1.c_w_id,customer1.c_d_id,customer1.c_id] |
|              ├─ filters: [{[1, 1], [5, 5], [NULL, ∞)}]                    |
|              └─ columns: [c_id c_d_id c_w_id c_first c_last]              |
+---------------------------------------------------------------------------+
Costed index scans and joins#
And finally, a combination of functional dependencies and table statistics trimmed the heaviest of the query plans. Joins and index scans are subject to data skew variability, which means two databases with the same schemas but different data distributions will have different optimal plans. In our case, one particular TPC-C query required a specific index scan, join order, and join operator that executed 10x faster than the other dozen options.
Here was the query plan from a year ago that took between 50-200ms to execute:
> explain SELECT c_discount, c_last, c_credit, w_tax FROM customer1, warehouse1
  WHERE w_id = 1 AND c_w_id = w_id AND c_d_id = 1 AND c_id = 1019;
+-------------------------------------------------------------------------------------------------+
| plan                                                                                            |
| Project                                                                                         |
+-------------------------------------------------------------------------------------------------+
|  ├─ columns: [customer1.c_discount, customer1.c_last, customer1.c_credit, warehouse1.w_tax]     |
|  └─ IndexedJoin(customer1.c_w_id = warehouse1.w_id)                                             |
|      ├─ IndexedTableAccess(warehouse1)                                                          |
|      │   ├─ index: [warehouse1.w_id]                                                            |
|      │   ├─ filters: [{[1, 1]}]                                                                 |
|      │   └─ columns: [w_id w_tax]                                                               |
|      └─ Filter((customer1.c_d_id = 1) AND (customer1.c_id = 1019)) |
|          └─ IndexedTableAccess(customer1)                                                       |
|              ├─ index: [customer1.c_w_id,customer1.c_d_id,customer1.c_id]                       |
|              └─ columns: [c_id c_d_id c_w_id c_last c_credit c_discount]                        |
+-------------------------------------------------------------------------------------------------+
And here is the new plan that sidesteps a broader range of join
operators (MERGE, HASH) but injects the customer1 filters into the
index lookup:
+---------------------------------------------------------------------------------------------+
| plan                                                                                        |
+---------------------------------------------------------------------------------------------+
| Project                                                                                     |
|  ├─ columns: [customer1.c_discount, customer1.c_last, customer1.c_credit, warehouse1.w_tax] |
|  └─ LookupJoin                                                                              |
|      ├─ IndexedTableAccess(warehouse1)                                                      |
|      │   ├─ index: [warehouse1.w_id]                                                        |
|      │   ├─ filters: [{[1, 1]}]                                                             |
|      │   └─ columns: [w_id w_tax]                                                           |
|      └─ Filter                                                                              |
|          ├─ ((customer1.c_d_id = 1) AND (customer1.c_id = 1019))                            |
|          └─ IndexedTableAccess(customer1)                                                   |
|              ├─ index: [customer1.c_w_id,customer1.c_d_id,customer1.c_id]                   |
|              ├─ columns: [c_id c_d_id c_w_id c_last c_credit c_discount]                    |
|              └─ keys: warehouse1.w_id, 1, 1019                                              |
+---------------------------------------------------------------------------------------------+Future#
Dolt benchmarks about 2x MySQL’s performance on sysbench reads and writes but 4-5x on TPC-C. This is somewhat surprising given the queries are similar and both profiles are disk-limited. One theory is that TPC-C is limited by the slowest query in the composition (index scan ~4x MySQL). But it is also possible that we need to dig deeper into resource management, caching, and/or read/write amplification for the TPC-C database to explain the difference.
The second area of expansion is scalability. We have mainly tested single threading so far. But we are interested in benchmarking and improving multi-client throughput, which is harder to quantify but potentially more useful for users.
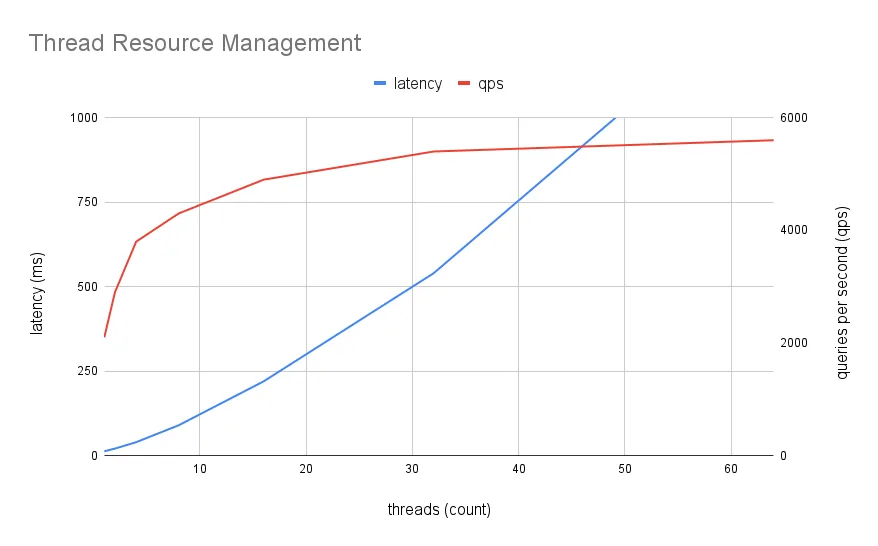
The plot below shows how adding more threads increases the number of queries performed up to a resource limit, which is about 6000 queries per second (sqps) on my laptop. Lowering the latency will increase our max qps. But more clients also means more threads contesting to commit the next transaction. Most threads fail to merge their updates and have to retry. And at a certain limit, the resources devoted to the one client whose transaction wins the next round becomes so low that the overall throughput rate falls.

All databases have scaling limits where partitioning and read replicas are required to handle high loads. But we can still squeeze more out of single node. Our unique isolation model (a Prolly Tree) will make this an interesting challenge.
Summary#
Dolt doubled its single threaded TPC-C performance in the last year and a half, but there is still much to do. Improving transactional throughput is different than single query latency but just as important. Look forward to updates in the near future as we try to narrow our gap to 3x of MySQL’s performance.
If you have any questions about Dolt, databases, or Golang performance reach out to us on Twitter, Discord, and GitHub!