Dolt is the only version controlled SQL database that supports Git semantics. We have added a lot of performance gains to the SQL side this year to mostly predictable places. For example, adding statistics for costed join planning guards against unoptimal join plans. Merge-sorting index rebuilds avoids expensive virtual memory swapping when working sets overflow main memory.
Today is a bit weirder. We noticed that some database import scripts were taking minutes to import 10’s of thousands of rows. The rows were big, but not big enough to justify spending 90% of the runtime IO’ing the script.

Big Dolt imports become snagged on a bad interaction between two Golang standard library packages. We will walk through this interaction, some options for fixing it, and the performance implications of big Dolt imports moving forward.
Problematic Profile#
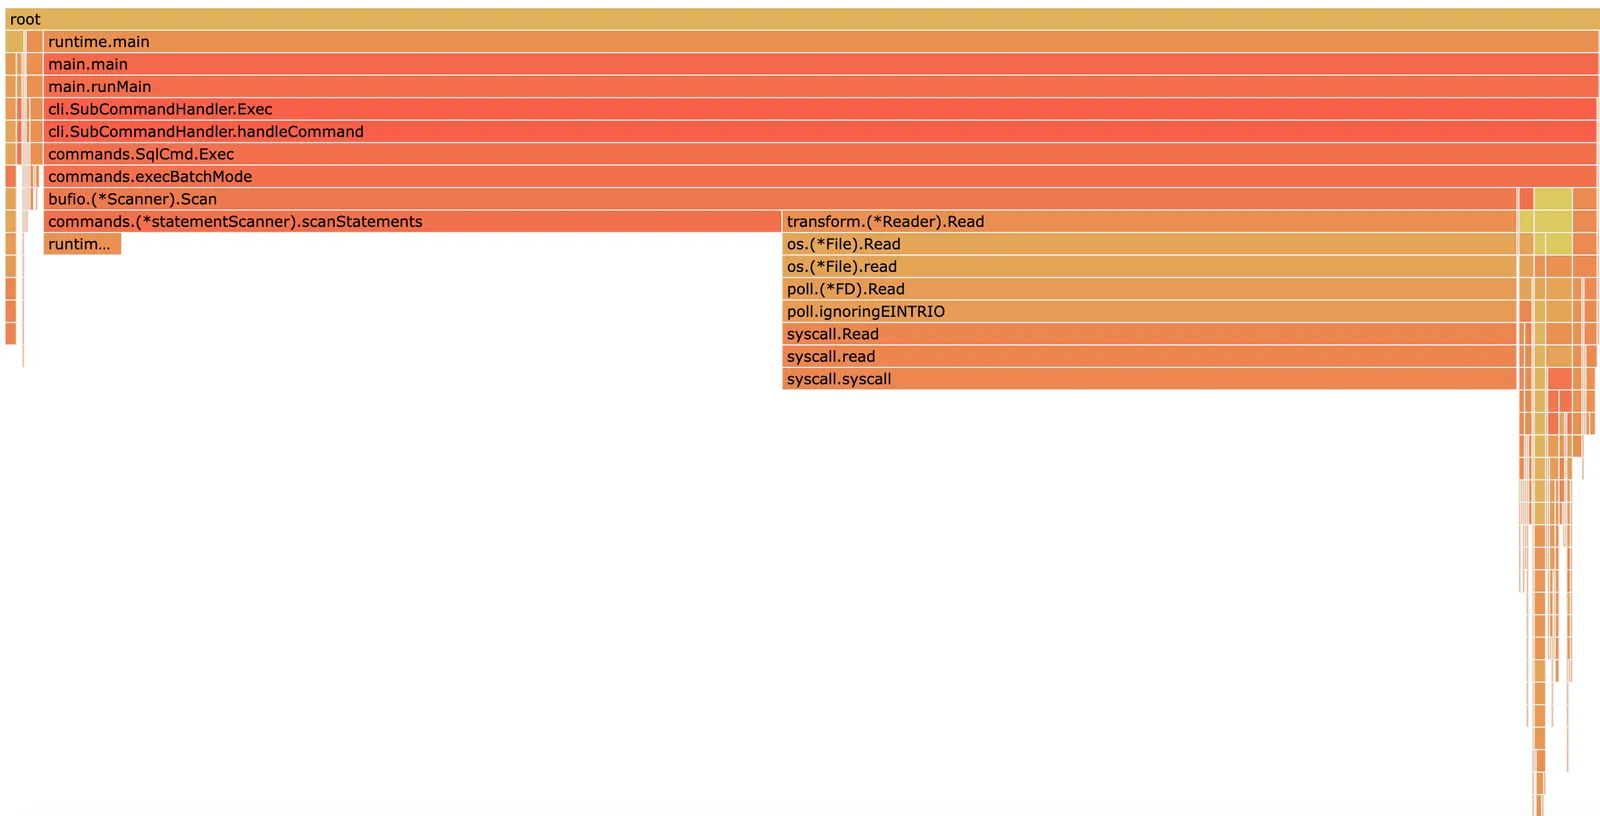
The CPU profile is dominated by syscall.read and *statementScanner.scanStatements calls. syscall.read indicates the amount of CPU time spent issuing the request, separate from the kernel syscall.read invocation that actually copies the input file to main memory. scanStatements is a callback that seeks the first semicolon (;) not enclosed in a string in the input file buffer.
It is unusual for a query to be bottlenecked on I/O before any of the actual work starts. So what exactly is going on?
Scanning Components#
There are a few notable overlapping lifecycles. The first is that the input is buffered through several readers. A page-sized buffered reader pulls bytes into a buffer to batch sequences of small read calls. The reader feeds into the scanner package, which uses a callback to seek a line split in its own buffer. And the Dolt-specific line splitter tries to either (1) update the delimiter, or (2) seek the current non-string enclosed delimiter.
The sequence of these steps sounds fine in theory, but in practice their lifecycles synchronize poorly.
We will walk through a toy benchmark that replicates the problem (code here).
Below is a splitter type that can track invocations of the scanner callback. We count the number of calls and the total number of bytesProcessed before hitting EOF:
type splitter struct {
	calls          int
	bytesProcessed int
}

func (s *splitter) split(data []byte, atEOF bool) (advance int, token []byte, err error) {
	if atEOF && len(data) == 0 {
		return 0, nil, nil
	}
	s.calls++
	s.bytesProcessed += len(data)
	if atEOF {
		return len(data), data, nil
	}
	return 0, nil, nil
}
Here is the function that will create and invoke a splitter for a particular input:
func cntRead(inp io.Reader) (int, int) {
	// initialize scanner with maximum buffer size and |splitter| callback
	scanner := bufio.NewScanner(inp)
	scanner.Buffer(make([]byte, 2<<11), 1<<24)
	sp := new(splitter)
	scanner.Split(sp.split)

	// seek delimiter
	for scanner.Scan() {
	}

	// return call count and bytes processed
	return sp.calls, sp.bytesProcessed
}
And here is a benchmark of 4KB, 8KB, 16KB, and 4.9MB line sizes:
func main() {
	sizes := []int{2 << 11, 2 << 12, 2 << 13, 4_900_000}
	var inp io.Reader
	for _, sz := range sizes {
		inp = bytes.NewReader(make([]byte, sz))
		inp = transform.NewReader(inp, textunicode.BOMOverride(transform.Nop))
		splitCalls, bytesProcessed := cntRead(inp)
		log.Printf("size: %d, splits: %d, bytes: %d", sz, splitCalls, bytesProcessed)
	}
}
When we run the benchmark, we see that the splitter callback count scales linearly with the line size, and and number of bytes processed scales polynomially:
2009/11/10 23:00:00 size: 4096, splits: 2, bytes: 8192
2009/11/10 23:00:00 size: 8192, splits: 3, bytes: 20480
2009/11/10 23:00:00 size: 16384, splits: 5, bytes: 57344
2009/11/10 23:00:00 size: 4900000, splits: 1198, bytes: 2941741376
What happens is (1) we read a page into the transform.Reader, (2) append that page to the scanner buffer, and then (3) call the splitter on the scanner buffer contents. If a query is less than 4k bytes, we finish on the first try. If a query is more than 4k bytes, we iteratively call this cycle until we’ve read the page with the delimiter.
The query we profiled about is about 4.9MB long, or about 1200 4KB pages. Finding the delimiter for this query requires 1200 cycles of (1) read one page, (2) append that page to the scanner buffer, (3) call the split function on the scanner buffer. The split function is called 1200 times on the (4KB, 8KB, …, 4.9MB) buffers, processing about 2.9GB of data (1200*(4KB+4.9MB)/2). And for powers of 2, the scanner buffer is going to double in size and copy all of its contents. This doubling will happen 12 times (2^11 -> 2^23).
Differential Diagnosis#
Skip 4k Buffer#
If we don’t pre-buffer the input, then the scanner can saturate its buffer for every doubling. We can microbenchmark this my commenting out the transform.NewReader line above:
// inp = transform.NewReader(inp, textunicode.BOMOverride(transform.Nop))The output now looks like:
2009/11/10 23:00:00 size: 4096, splits: 2, bytes: 8192
2009/11/10 23:00:00 size: 8192, splits: 3, bytes: 20480
2009/11/10 23:00:00 size: 16384, splits: 4, bytes: 45056
2009/11/10 23:00:00 size: 4900000, splits: 13, bytes: 18184512
Instead of performing 1200 cycles and processing 2.9GB of data, we will perform 13 cycles and process ~20MB of data. Testing this in Dolt’s import brings the runtime from 470 seconds to 76 seconds!
Unfortunately, we depend on the double buffer for correctness. The buffer implements a textunicode.BOMOverride transform to standardize input. We could inline this check, but we would have to maintain our own fork, and compartmentalized reader interfaces are more developer friendly.
Stream Pages#
The better solution keeps BomOverride buffer, but only process each page once. Here’s what Dolt’s custom scanner implementation loop looks like:
func (s *streamScanner) Scan() bool {
	for {
		// process incremental read into buffer
		ok := s.seekDelimiter()
		if ok {
			// delimiter found, scanner holds valid token state
			return true
		} else if s.isEOF && s.i == s.fill {
			// token terminates with EOF
			s.state.end = s.fill
			return true
		}
		// haven't found delimiter yet, keep reading
		if err := s.extendBuffer(); err != nil {
			s.err = err
			return false
		}
	}
}
We still double the buffer size and read input until we find a delimiter. But we incrementally scan input. No bytes are re-processed:
2009/11/10 23:00:00 size: 4096, splits: 2, bytes: 4096
2009/11/10 23:00:00 size: 8192, splits: 3, bytes: 8192
2009/11/10 23:00:00 size: 16384, splits: 4, bytes: 16384
2009/11/10 23:00:00 size: 4900000, splits: 13, bytes: 4900000
The new runtime for with streaming is now 71 seconds, a little better!
Bonus Optimization#
We found a bonus optimization after reworking the scanner. Interface inefficiencies are causing each query to be parsed twice:

When we skip this step, the final import time is 61 seconds. An 83% improvement from the starting point! Here is a summary of the accumulation of fixes:
| impl | time |
|---|---|
| original | 470 sec |
| one buf | 76 sec |
| stream | 71 sec |
| stream+ | 61 sec |
Write Throughput#
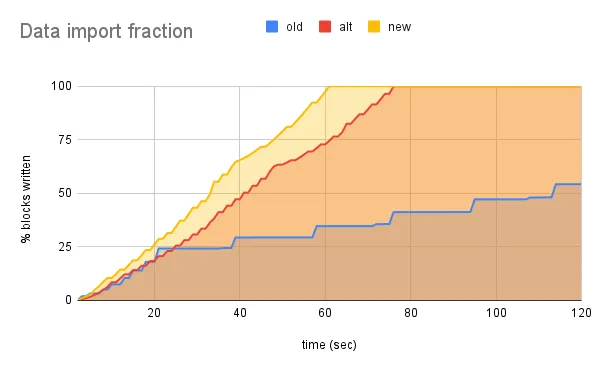
Just for fun, here is one last look into the performance differences between the scanning strategies. The x-axis is time, and the y-axis is the I/O blocks written as a fraction of the final database size according to vmstat:

The blue line is the original write throughput, the red line elides the BOM buffer, and the yellow line streams the import file (including BOM buffering). All of the lines follow the same shape. The faster we execute the same SQL statements the more leftwards the line shifts.
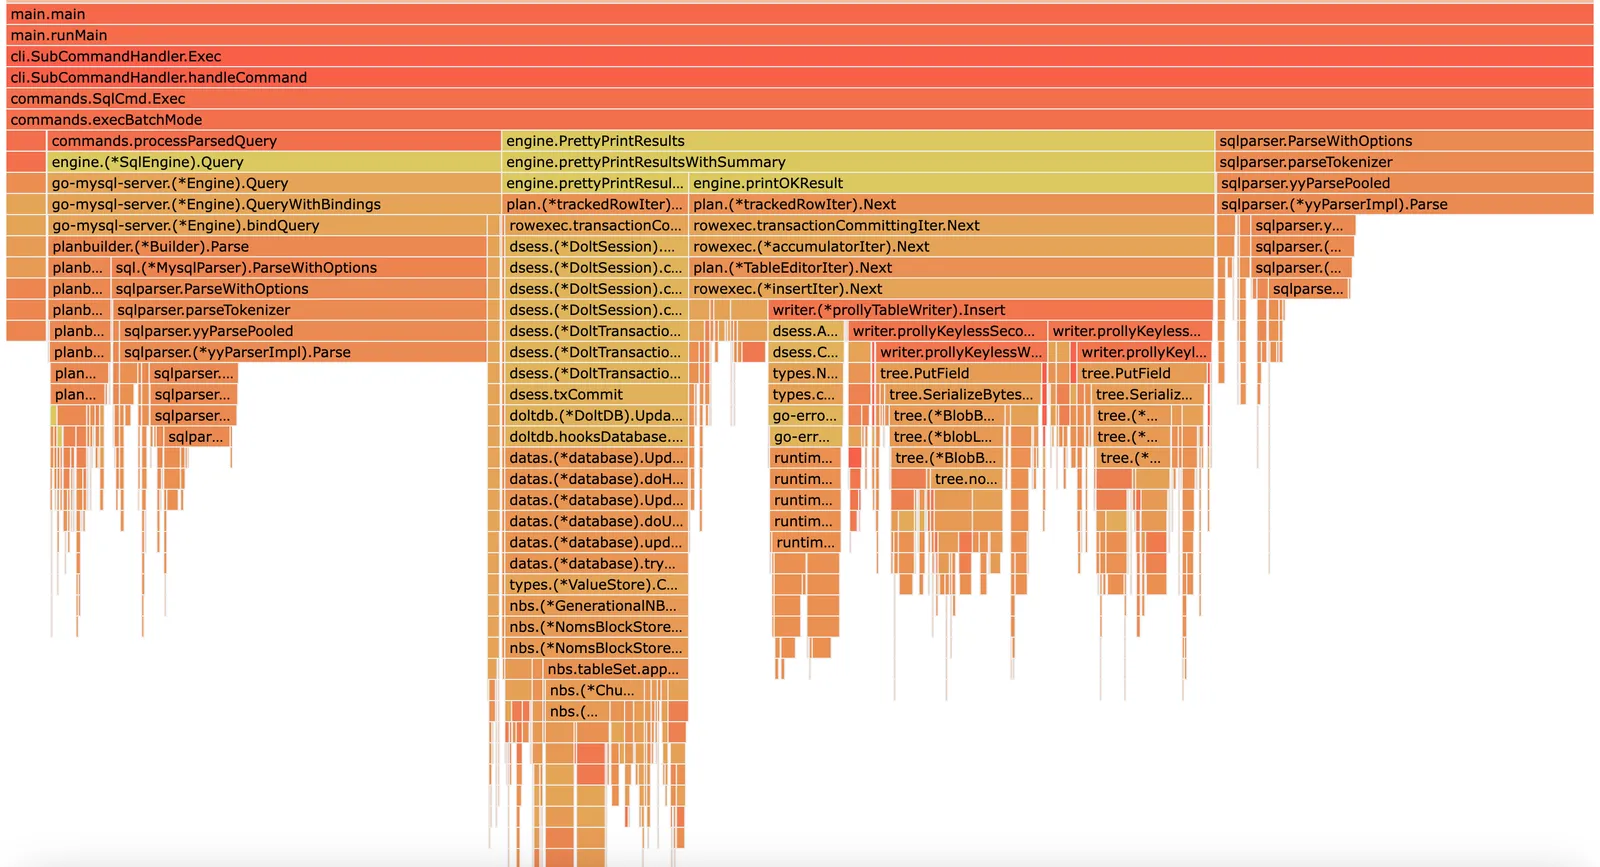
The CPU profile before shows that we are CPU bound (1) parsing and (2) serializing blobs. But imports spend a significant fraction of time performing I/O, and there is also a noticeable kink in the write throughput. The flat curve is about 10k blocks/sec, and the steep curve is about 15k blocks/sec. The flat portions correspond to initial table writes. We write data faster the longer we continue updating the same table. We “lose momentum,” so to speak, whether from replacing our internal node caches, or abruptly fsync()ing one table before writing the next. We were already planning on investigating write performance in the following months for TPC-C, but that work might improve import speed too!
Summary#
We walked through an example where double buffering the input to the standard input scanner leads to pathological behavior. Because the scanner is called iteratively, narrowing the rate at which the split buffer grows can cause a scanner to process the same bytes thousands of times when a line exceeds a page.
We took the opportunity to stream process reading import scripts, and take a closer look at the I/O efficiency at the write-end of imports.
If you have any questions about Dolt, databases, or Golang performance reach out to us on Twitter, Discord, and GitHub!