Announcing the Dolt log graph
Last week, we discussed the implementation of commit graph on DoltHub. Today, we're excited to explore this topic further! We've recently launched two new commands in Dolt: dolt log --graph and dolt log --graph --oneline. The dolt log --graph command shows a graph of the commit history, while adding the --oneline flag condenses each commit to a single line, making the graph more compact.

Benefits of the log graph
Many Git users find git log --graph extremely helpful for its clear visual display of how commits, branches, merges, and pull requests relate to one another. In response to similar requests from Dolt users, we implemented the graph visualization in Dolt with the dolt log --graph and dolt log --graph --oneline commands.
These commands provide a comprehensive visual representation of the relationships between commits, making it easier to understand the commit history and track changes more effectively. This visualization is particularly useful for seeing how different branches converge and diverge, simplifying the management of complex projects.
Draw commit graph in the terminal
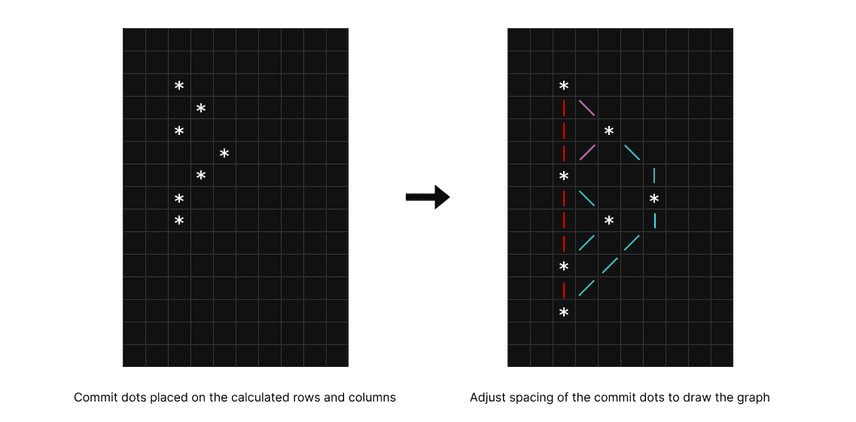
In our previous post, we discussed an algorithm for determining the row positions and column positions of commit dots in the commit graph, which can also be used for the terminal output of the dolt log --graph command. It is important to note that these positions are not exactly where the dots will appear in the terminal or on a webpage. Due to the adjacency of rows and columns, dots will cluster closely together if the initial positions calculated from the algorithm are applied directly. To address this, we introduced spacing adjustments on the web, using branchSpacing and commitSpacing, and we shortened the commit messages to maintain a uniform height for each commit block, displaying the full message upon hover:
export function getCommitDotPosition(
  branchSpacing: number,
  commitSpacing: number,
  nodeRadius: number,
  commit: CommitNode,
) {
	const x = branchSpacing * commit.x + nodeRadius * 4;
	const y = commitSpacing * commit.y + nodeRadius * 4;
	return { x, y };
}
However, the terminal representation of a commit graph takes a different approach. Building on the grid concept introduced in our last blog, the text-based graphical representation of the commit history in the terminal is a grid of characters rather than pixels on a webpage. We draw the graph with |, /, \ and - characters. This results in a sparser layout, affecting how commit dots are placed and connected.
Determining the vertical space of a commit
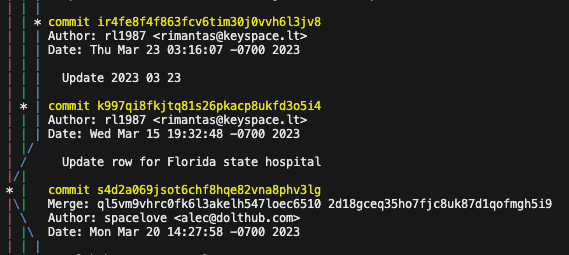
The vertical space a commit occupies in a terminal display can vary. This is due to factors such as the length of the commit message and whether we need to output additional information like a merge. In the example below, a commit has a three-line commit message. This variation requires a flexible approach to spacing, instead of a uniform spacing for all cases.
Calculating the number of lines for a commit
The lines needed for each commit includes:
- One line for the commit hash.
- One line each for the author and the date.
- An additional line if it is a merge commit.
- A blank line as a separator.
- The number of lines in the commit message.
Here’s a Go function that calculates the height of a commit:
func getHeightOfCommit(commit *commitInfoWithChildren) int {
	height := 4 + len(commit.formattedMessage)
	if len(commit.Commit.parentHashes) > 1 {
		height = height + 1
	}
	return height
}
Adjusting the commit dot position
To prevent overlaps and maintain a clean layout, the positions of commit dots are adjusted based on the calculated line numbers:
func expandGraphBasedOnCommitMetaDataHeight(commits []*commitInfoWithChildren) {
	posY := 0
	for _, commit := range commits {
		// one empty column between each branch path
		commit.Col = commit.Col * 2
		commit.Row = posY
		formattedMessage := strings.Split(commit.Commit.commitMeta.Description, "\n")
		commit.formattedMessage = formattedMessage

		posY += getHeightOfCommit(commit) + 1
	}
}
Connecting the Dots
Now that we have the row and column positions, we can start drawing the paths between commits and their parents to construct the graph. There are three types of paths, determined by the relative positions of the child commit and the parent commit.
1. Vertical Path: Child and Parent in the Same Column
When the child and parent commits align vertically within the same column, a vertical line is drawn using the | character:
for r := row + 1; r < parentRow; r++ {
	graph[r][col] = branchColor.Sprintf("|")
}
2. Diagonal Path: Child to the Left of Parent
If the child commit is to the left of the parent, which usually indicates that the child commit is a merge, a diagonal line is drawn using the \ character. Depending on the relative vertical and horizontal distances between the two commits, additional characters may be added to extend the line.
- Vertical Extension:
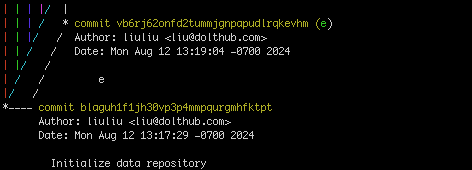
If the vertical distance exceeds the horizontal distance, a vertical line is drawn alongside the parent commit’s column to meet the diagonal. Below is an example of how this connection is made:
This is the Go implementation:
for i := col + 1; i < parentCol; i++ {
	graph[row+i-col][i] = branchColor.Sprintf("\\")
}
for i := row + parentCol - col; i < parentRow; i++ {
	graph[i][parent.Col] = branchColor.Sprintf("|")
}- Horizontal Extension:
In rare cases where the horizontal distance exceeds the vertical, a horizontal line is drawn along the child’s row:
for i := 0; i < verticalDistance; i++ {
	graph[parentRow-i][parentCol-i] = branchColor.Sprintf("\\")
}
for i := col + 1; i < parent.Col-verticalDistance+1; i++ {
	graph[row][i] = branchColor.Sprintf("-")
}
3. Diagonal Path: Child to the Right of Parent
Conversely, if the child commit is to the right of the parent, this usually indicates a new branch is created. A diagonal line is drawn using the / character. Extensions are similarly managed:
- Vertical Extension:
Similar to the diagonal, but extends from the child's column upwards if the vertical surpasses the horizontal:
This implementation is demonstrated below:
for i := parentCol + 1; i < col; i++ {
	graph[parentRow+parentCol-i][i] = branchColor.Sprintf("/")
}
for i := parentRow + parentCol - col; i > row; i-- {
	graph[i][col] = branchColor.Sprintf("|")
}- Horizontal Extension:
When the horizontal distance exceeds the vertical, extend horizontally from the parent’s row.
This implementation is demonstrated below:
for i := 1; i < verticalDistance; i++ {
	graph[parentRow-i][parentCol+horizontalDistance-verticalDistance+i] = branchColor.Sprintf("/")
}
for i := parentCol; i < parentCol+(horizontalDistance-verticalDistance)+1; i++ {
	graph[parentRow][i] = branchColor.Sprintf("-")
}
Compact Graph View
For a more condensed version of the graph, you can use the --oneline flag, which reduces the display to a single line per commit. This compact view makes it easier to quickly scan through extensive commit histories. It provides an overview of changes without the clutter of full commit messages and details, ideal for identifying specific updates quickly.
The main adjustment in the --oneline graph compared to the standard dolt log --graph involves how the graph is expanded. Each commit is takes a single line, but placing these lines directly one after another would not leave sufficient space for rendering the graph's connectors, specifically the diagonal / and \ characters. To ensure there are enough grid spaces to accommodate these connectors, we calculate the maximum distance between parent and child commits to appropriately expand the graph.
func expandGraphBasedOnGraphShape(commits []*commitInfoWithChildren, commitsMap map[string]*commitInfoWithChildren) {
	posY := 0
	for i, commit := range commits {
		commit.Col = commit.Col * 2
		commit.formattedMessage = []string{strings.Replace(commit.Commit.commitMeta.Description, "\n", " ", -1)}
		if i > 0 {
			posY += 1
			for _, childHash := range commit.Children {
				if child, ok := commitsMap[childHash]; ok {
					horizontalDistance := math.Abs(float64(commit.Col - child.Col))
					if horizontalDistance+float64(child.Row) > float64(posY) {
						posY = int(horizontalDistance + float64(child.Row))
					}
				}
			}
		}
		commit.Row = posY
	}
}
For those interested in the implementation details, the code for the graph drawing used in the Dolt log can be found here.
Comparing to the Git Log Graph
We adapted our web graph algorithm to the terminal graph implementation, which allowed us to quickly deploy this feature. As a result, the Dolt log graph closely mirrors the DoltHub graph, ensuring that the same commit history appears identical on both platforms. This consistency also means that updates made on one can easily be applied to the other. Our graph style looks different from the git log --graph. It's fun to compare the graph difference and analyze git's graph drawing decisions.
An example
Let’s examine an example where we create three branches (branch-a, branch-b, branch-c) off main, commit once on each, and then merge them back into main. We perform these operations in Dolt and Git to compare their graphical outputs.
Here are the steps executed in Dolt:
dolt init
dolt checkout -b branch-a
dolt commit --allow-empty -m "commit on branch-a"
dolt checkout main
dolt checkout -b branch-b
dolt commit --allow-empty -m "commit on branch-b"
dolt checkout main
dolt checkout -b branch-c
dolt commit --allow-empty -m "commit on branch-c"
dolt checkout main
dolt commit --allow-empty -m "commit on main"
dolt merge branch-a
dolt merge branch-b
dolt merge branch-c
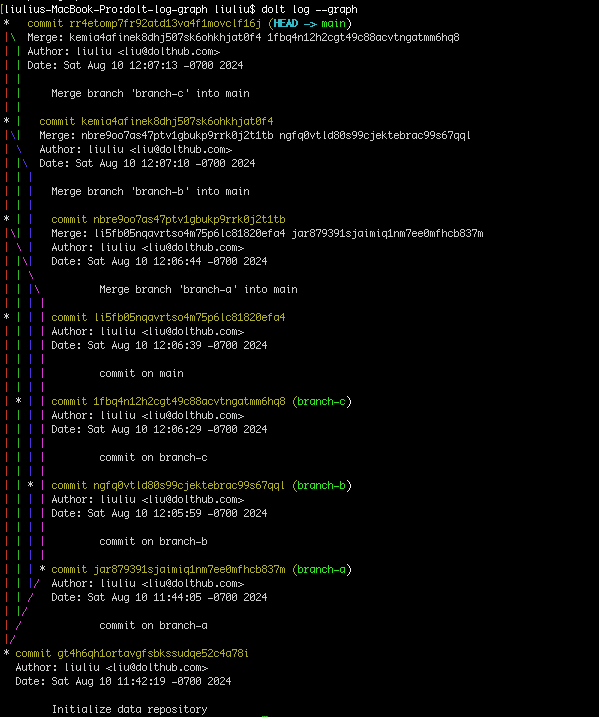
When we run dolt log --graph, we get the following graph:
The dolt init command creates an initial commit, so we initialize Git similarly in order to create an equal graph comparison.
git init --initial-branch=main
git commit --allow-empty -m "initialize git repository"
git checkout -b branch-a
git commit --allow-empty -m "commit on branch-a"
git checkout main
git checkout -b branch-b
git commit --allow-empty -m "commit on branch-b"
git checkout main
git checkout -b branch-c
git commit --allow-empty -m "commit on branch-c"
git checkout main
git commit --allow-empty -m "commit on main"
git merge branch-a
git merge branch-b
git merge branch-c
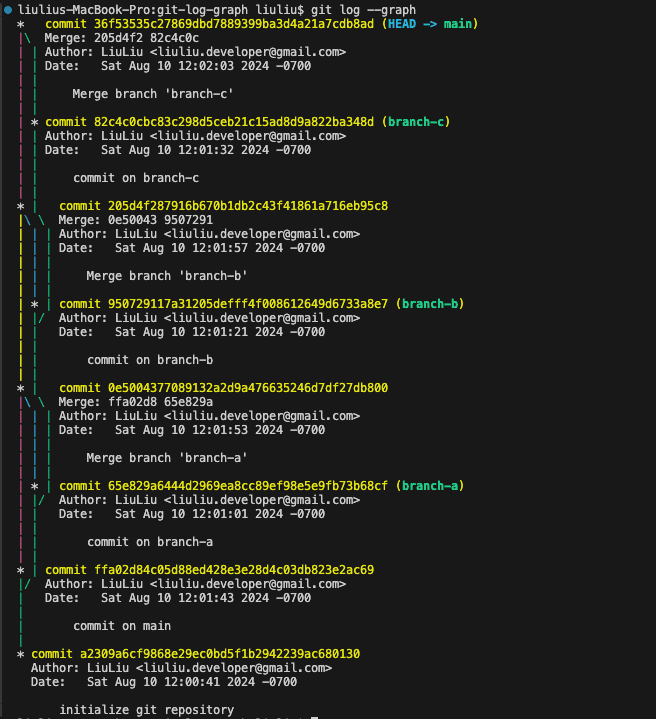
Running git log --graph prints this graph:
Git's graph does not strictly adhere to chronological order, which can be misleading. For instance, the commit 82c4c0c on branch-c is displayed as a newer commit than the merge of branch-b (commit 205d4f2), suggesting an incorrect sequence of events. The advantage of doing this is that it shortens the path from a merge commit to its parent commits, making it easier to locate parent commits.
Additionally, although all three branches originate from main, Git's graph suggests a sequential dependency: branch-b seems to extend from branch-a, and branch-c from branch-b. While this maintains the technical correctness of the graph, it can make the relationships between branches less clear. However, this approach keeps the graph as narrow as possible; for instance, even though our example has four active branches, Git's graph displays a maximum of three branch paths side by side. This compactness is particularly beneficial in larger graphs with many ongoing branches.
Dolt uses topological sorting for commits, where ties are broken by timestamps to ensure that newer commits appear first. This approach maintains the chronological order, making the commit history more intuitive. Git employs a "Generation Number" for topological sorting to enhance performance by reducing the need to walk the entire graph. This method is explained in the blog post Supercharging the Git Commit Graph III: Generations and Graph Algorithms.
Conclusion
We hope the dolt log --graph and dolt log --graph --oneline commands will enhance your Dolt experience by providing concise views of your project histories. Let us know how they work for you! Join us on Discord, or share your ideas on GitHub. Your input helps us make Dolt even better!

