In a previous blog, we announced the release of the DoltHub commit graph and briefly discussed its implementation. Since then, we have written and adopted our own commit graph npm package. This blog will walk you through the key aspects and implementation details of how we draw the commit graph on DoltHub.
You can find the commit graph on DoltHub by navigating to your database, selecting the Commit Log tab, and clicking the Show Commit Graph button to display the graph.
Deciding to build our own commit graph npm package#
Initially, we used the gitgraph npm package for our commit graph UI on DoltHub. However, this package has several limitations for our use case. It has not been maintained since 2019 and is now archived. The package does not support pagination well; although we managed a workaround by forking and modifying it. We quickly learned it’s difficult to customize. Additionally, the underlying algorithm is unclear and renders all commits from deleted branches on the same path, even if they originated from different branches. These issues prompted us to implement our own commit graph package.
What is a commit graph?#
In our previous blog, we provided a clear and technical explanation of the commit graph. The commit graph is defined as a “directed acyclic graph”. We can imagine branches as garden paths made of stepping stones, where each stone represents a commit. The garden’s entrance is the initial commit, and when a path diverges, it indicates the creation of a new branch. When paths converge, it indicates a merge.
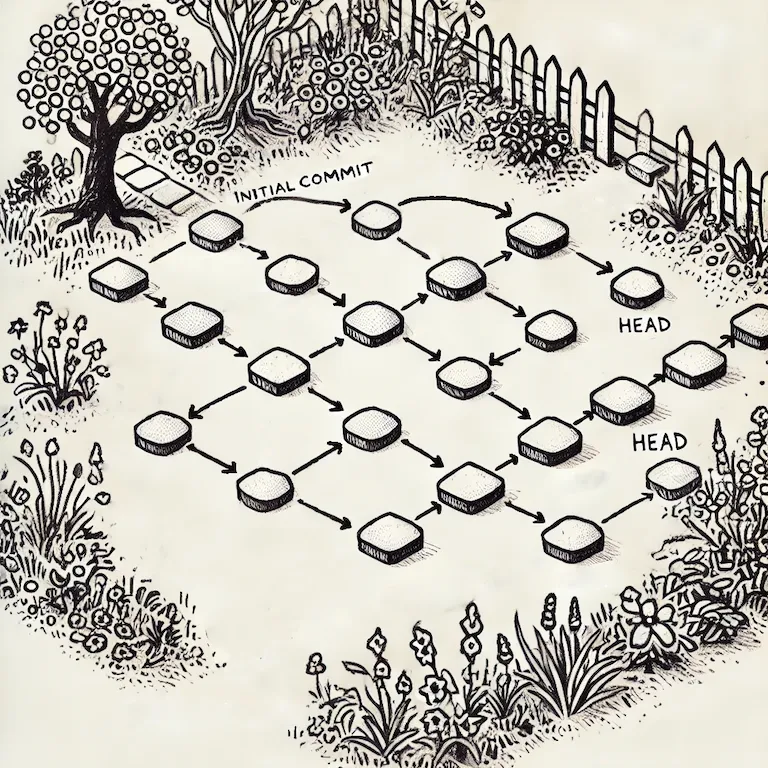
Commit graphs are useful in Git and Dolt because they visually show the history and relationships between commits. This helps developers see the progression of changes, identify merge points, and understand how branches are connected. They make it easier to track the development process, especially in projects with many contributors and branches.
Drawing the graph in Javascript#
This section will guide you through the process of visualizing the commit graph using JavaScript, detailing how to draw the graph and the logic behind it.
The parents and children#
Parents and children in a commit graph refer to the relationships between different commits. Similar to Git, each commit object stores a parents array. Commits can have zero to many parents. The initial commit has zero parents, a normal commit has one parent (representing the previous commit), and a merge commit has multiple parents. This explains the relationships between commits, with each commit tracking the commit/commits that came before it. From the parents array, we get the directed edge from the child commit to the parent.
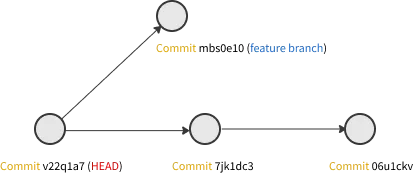
However, when drawing the graph, we are more interested in how the parents point towards the children.

Generating a children commits array is straightforward. We iterate through each commit and its parents to build a childrenMap that records which commits are children of each parent commit. In the formatCommits function, we also initialize the position of each commit with (-1, -1).
export function formatCommits(commits: Commit[]): CommitNode[] {
  const childrenMap: Map<string, Array<string>> = new Map();
  commits.forEach(commit => {
    commit.parents.forEach(parent => {
      if (childrenMap.get(parent.sha)) {
        childrenMap.get(parent.sha)?.push(commit.sha);
      } else {
        childrenMap.set(parent.sha, [commit.sha]);
      }
    });
  });
  return commits.map(commit => {
    return {
      hash: commit.sha,
      parents: commit.parents.map(p => p.sha),
      children: childrenMap.get(commit.sha) ?? [],
      committer: commit.commit.author.name,
      message: commit.commit.message,
      commitDate: new Date(commit.commit.author.date),
      commitLink: commit.html_url,
      commitColor: "",
      x: -1,
      y: -1,
    };
  });
}
The grid#
Imagine the page or canvas where we will draw the graph with invisible grids. The challenge is determining where to place the commit dots. Once their positions are set, we can connect them according to the parents array, forming the branch paths.
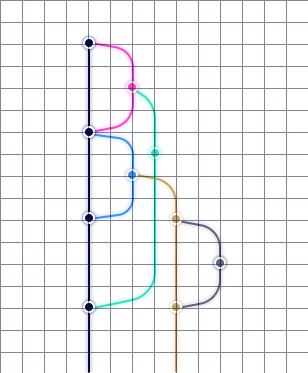
The commit position is determined by its row and column positions.
Row position#
Both Git and Dolt commits are sorted in topological order. We can use the commit index as its row position.
Column position#
Calculating the column position is more complex. We process from the HEAD commit to the initial commit, so child commits are calculated before their parents. We then determine the parent’s position based on its children’s positions.
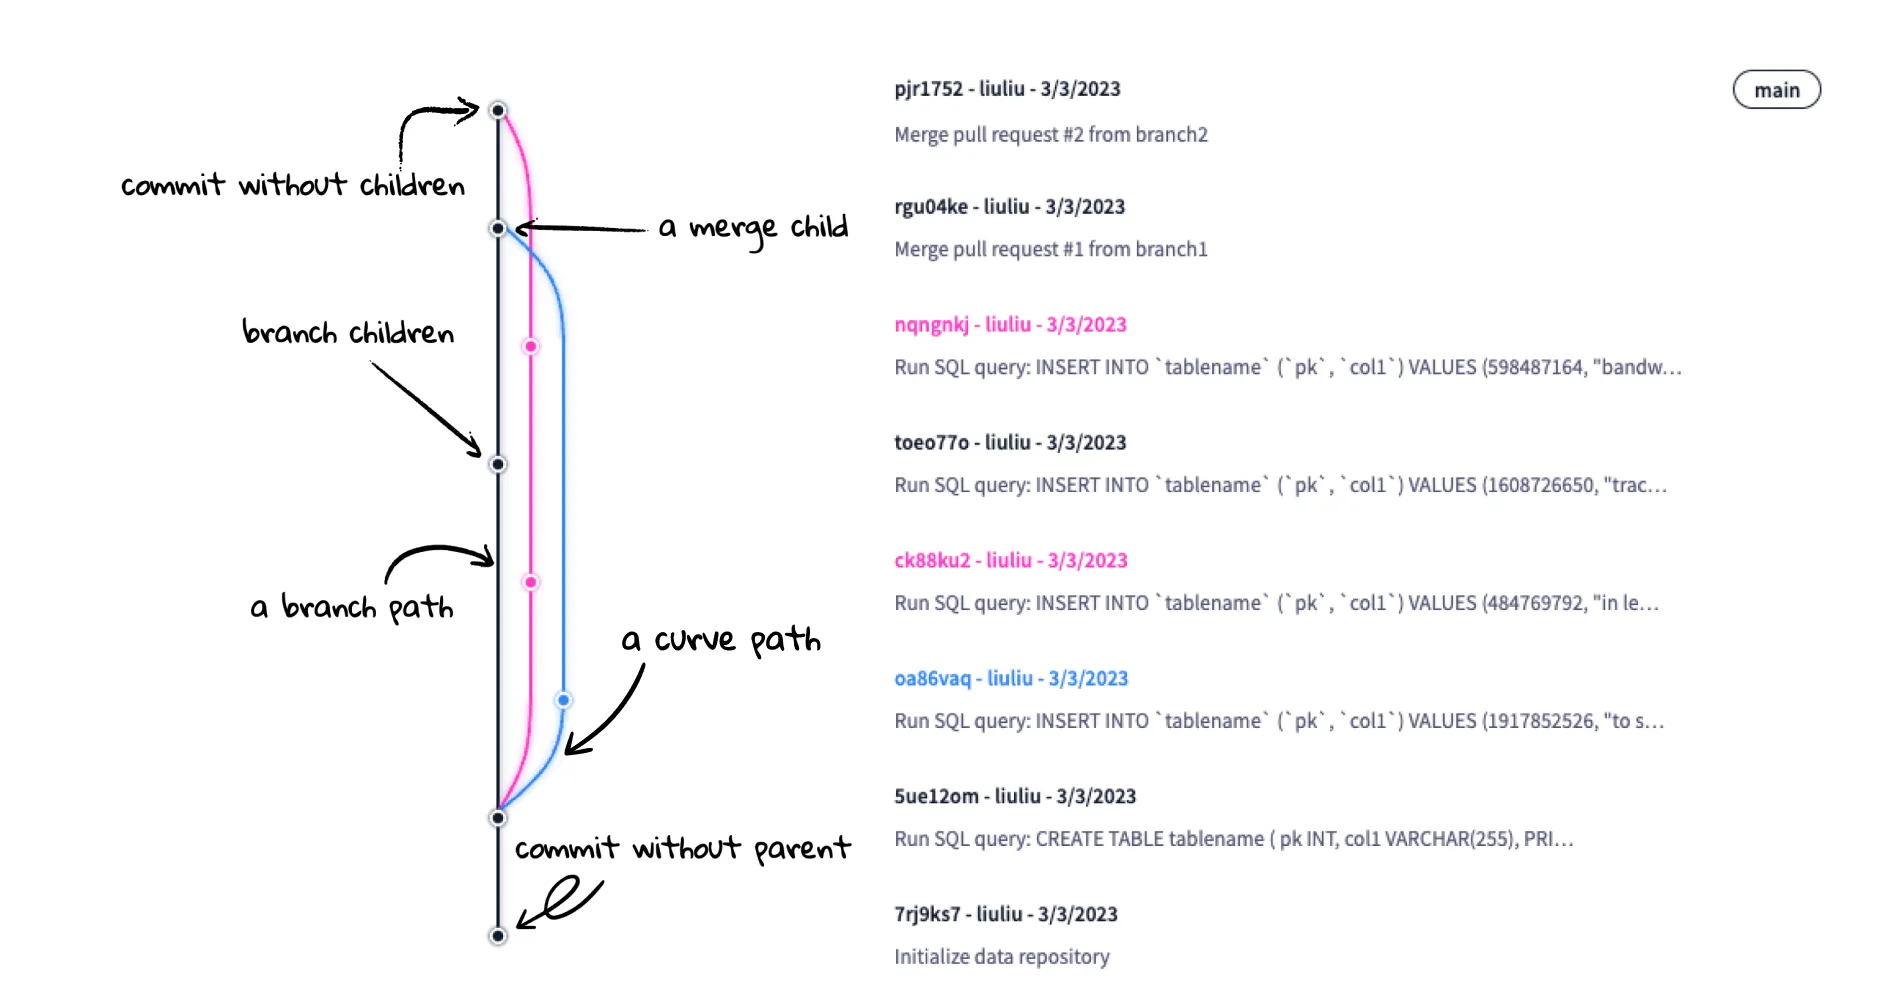
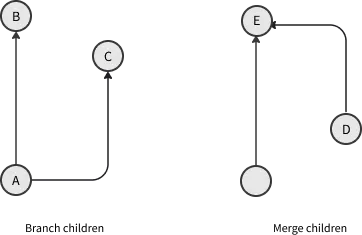
Inspired by pvigier’s blog, we can categorize the children of a commit into two types: branch children and merge children. A branch child is a child that either continues an existing branch or creates a new one, while a merge child is a child that ends a branch by merging it into another branch. As shown in the graph below, commit A has two branch children: commit B and commit C, and commit D has a merge child: commit E.
Commits fall into three types based on their children:
- Commits with no children: These are head commits on a branch and are placed in a new column. For example, the image below shows four head commits in four different columns.
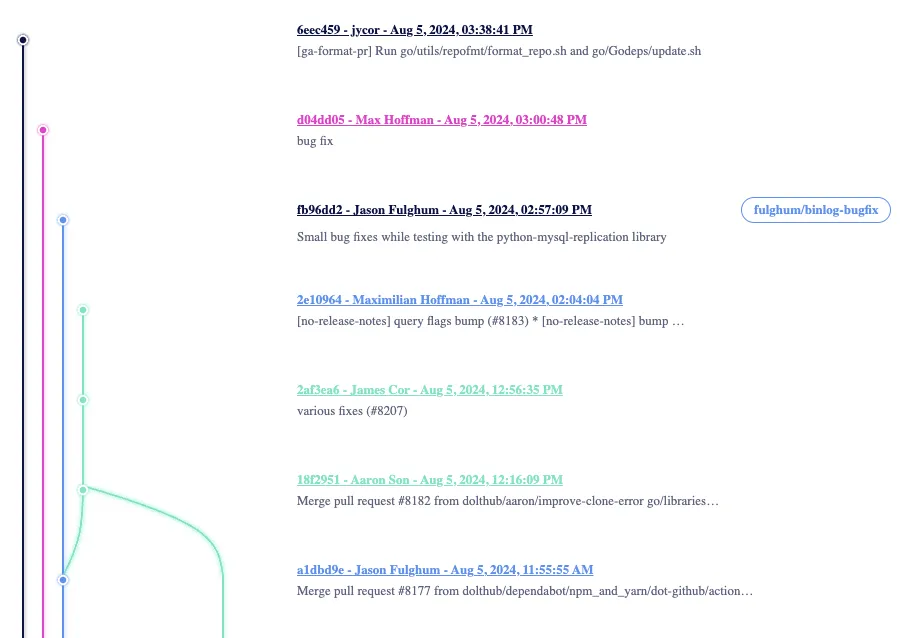
- Commits with branch children: These are placed in the column of the leftmost branch child. In the image above, commit
a1bd9chas two branch children:18f2951andfb96dd2. We place it in the column of the leftmost child,fb96dd2.
Here is the code to find the leftmost child’s column position and assign it to the current commit:
      const branchChildrenCols = branchChildren
        .map(childHash => commitCols.get(childHash))
        .filter(col => col !== undefined) as number[];

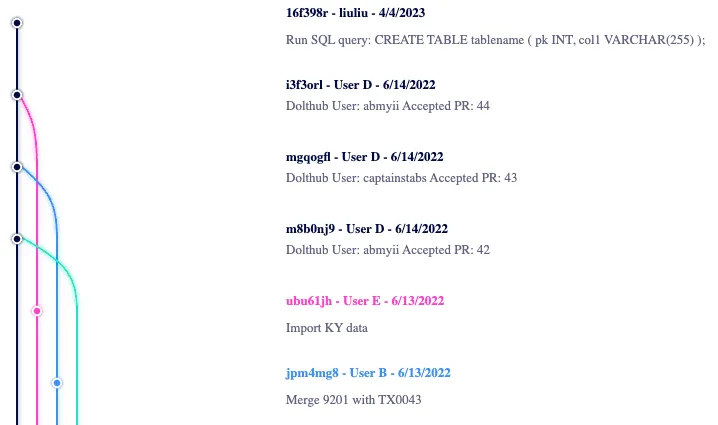
commitCol = Math.min(...branchChildrenCols);- Commits with no branch children but merge children: We start our search from the position of its leftmost child. We do this to ensure that the merge path points from right to left (<-|) rather than left to right (|->). We then look for an available column to place the commit. For example, in the image below, we need to find a column for commit
jpm4mg8. Its child commitmgqogflis in column 0. We then check column 1, which contains commitubu61jh, and see that the branch path is not ending there. So, we move to column 2, which is available, and place our current commit there.
Here’s the code:
const colFitAtEnd = columns.slice(maxChildCol + 1).findIndex((column) => {
  return minChildRow >= column[column.length - 1].end;
});

const col = colFitAtEnd === -1 ? -1 : maxChildCol + 1 + colFitAtEnd;

if (col === -1) {
  // if no available column is found, put the commit in a new column
  columns.push([
    {
      start: minChildRow + 1,
      end,
      endCommitHash: commit.hash,
      branchOrder,
    },
  ]);
  branchOrder++;
  commitCol = columns.length - 1;
} else {
  commitCol = col;
  columns[col].push({
    start: minChildRow + 1,
    end,
    endCommitHash: commit.hash,
    branchOrder,
  });
  branchOrder++;
}
Dots and paths#
Once we have the positions, we can draw the graph using SVG. The graph consists of dots and lines, which we can create with the circle and path elements.
Commit dots#
To create the commit dot, we can simply place a circle at the (x, y) position.
<circle
  cx="{x}"
  cy="{y}"
  r="{nodeRadius"
  *
  2
  +
  1.5}
  fill="{commit.commitColor}"
/>
We need to color the commit dots to indicate the branches they are on. We use feColorMatrix, which allows us to perform complex color manipulations. Therefore, we need to convert the colors accordingly:
function hexToColorMatrixVariant(hex?: string): string {
  if (!hex) {
    return "";
  }
  const r = parseInt(hex.substring(1, 3), 16) / 255;
  const g = parseInt(hex.substring(3, 5), 16) / 255;
  const b = parseInt(hex.substring(5, 7), 16) / 255;
  return `0 0 0 0 ${r} 0 0 0 0 ${g} 0 0 0 0 ${b} 0 0 0 0.5 0`;
}

function rgbColorToMatrixVariant(rgb: string): string {
  const [r, g, b] = rgb
    .toLowerCase()
    .replace("rgb(", "")
    .replace(")", "")
    .split(",")
    .map(x => parseInt(x) / 255);
  return `0 0 0 0 ${r} 0 0 0 0 ${g} 0 0 0 0 ${b} 0 0 0 0.5 0`;
}

export function convertColorToMatrixVariant(color: string): string {
  if (color.startsWith("#")) {
    return hexToColorMatrixVariant(color);
  }
  return rgbColorToMatrixVariant(color);
}
For example, the light orange color #FF5733 / rgb(255, 87, 51) converts to the following matrix variant value using the above functions: 0 0 0 0 1 0 0 0 0 0.3411764705882353 0 0 0 0 0.2 0 0 0 0.5 0. We can then use this value in the feColorMatrix element in SVG:
<feColorMatrix
  type="matrix"
  values="{convertColorToMatrixVariant(commit.commitColor)}"
/>
Branch path#
A branch path is a straight line, with (x1, y1) as the starting point and (x2, y2) as the ending point.
<line
  x1="{x}"
  y1="{start"
  *
  commitSpacing
  +
  nodeRadius
  *
  2}
  x2="{x}"
  y2="{end"
  *
  commitSpacing
  +
  nodeRadius
  *
  5}
  stroke="{branchColor}"
  strokeWidth="4"
/>
Curve path#
Drawing a curved path to connect the commit dots and branch paths in SVG can be challenging. The key is to determine the d attribute value in the path element, which defines the shape of the path:
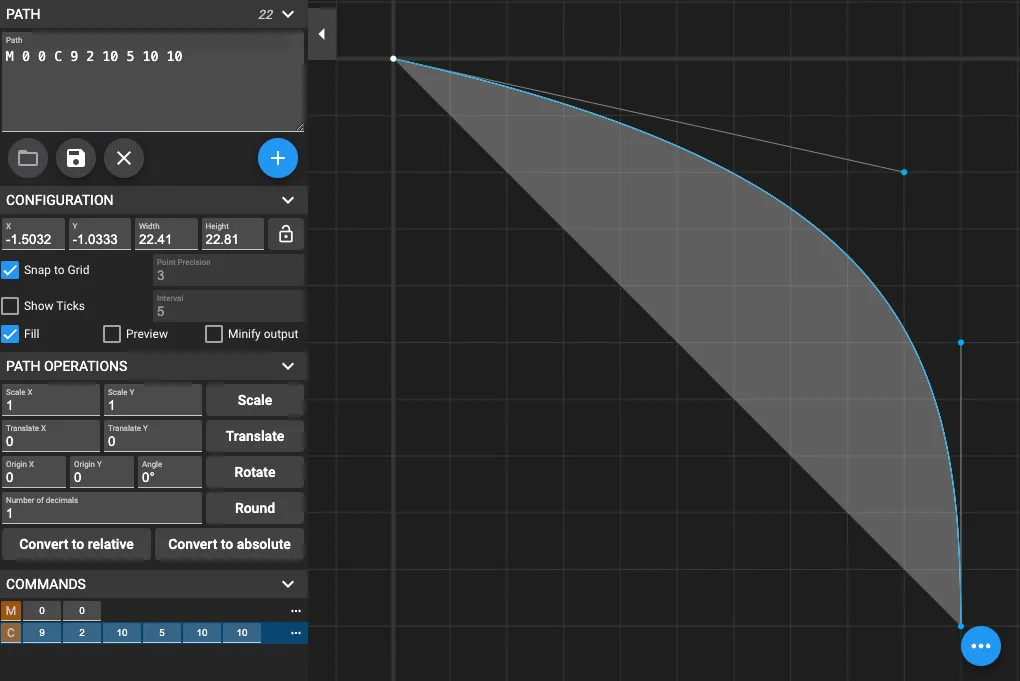
<path d="{path}" stroke="{curve.stroke}" strokeWidth="2" fill="none" />In our graph, a curve has two parts: a starting point of the commit dot and a Bézier curve, a smooth curve defined by control points and commonly used to model complex shapes in graphics. In SVG, a cubic Bézier curve is created using three points: two control points, and the end point. The path consists of M for “move to the starting point” and C for “cubic curve”. A useful tool for visualizing these curves is the SVG Path Editor, which allows you to see how your path data will render.
In the image below, we have the curve M 0 0 C 9 2 10 5 10 10, the start point of the curve is (0, 0), the Bézier curve is created by adding two control points: (9, 2) and (10,5), and it ends at (10, 10).
After experimenting with various variables, I wrote this function to construct a smooth curve to connect the commit dots and branch paths:
function curvePath(start: number[], end: number[]) {
  const cx1 = start[0] * 0.1 + end[0] * 0.9;
  const cy1 = start[1] * 0.6 + end[1] * 0.4;
  const cx2 = start[0] * 0.03 + end[0] * 0.97;
  const cy2 = start[1] * 0.4 + end[1] * 0.6;

  return `M ${start[0]} ${start[1]} C ${cx1} ${cy1}, ${cx2} ${cy2}, ${end[0]} ${end[1]}`;
}Conclusion#
This is how we draw the commit graph in DoltHub. If you’re interested, you can find the source code in React here. The package is also compatible with GitHub commits. We’d love to hear your feedback on Discord or you can file a feature request on GitHub. I’m always happy to discuss graph drawing!
