
Dolt is a MySQL-compatible SQL database that supports Git-like functionality, including branching, diffing, and merging. Dolt enables you to version control your data and your data’s schema, just like Git allows you to version control your code. Dolt is built from an open-source codebase written primarily in Go, and is compatible with MySQL, so you can swap in Dolt for any application or tool that uses MySQL. In this blog post, we’re looking at how you can use Datadog’s MySQL integration to build dashboards and monitor Dolt database servers.
Datadog#
Recently, one of our customers expressed interest in using Dolt with their existing Datadog monitoring setup. Since Dolt is MySQL-compatible and Datadog has MySQL integration, this seemed like a natural fit. Datadog is a monitoring and analytics platform designed to provide visibility into infrastructure and application metrics. It provides tools for building dashboards, setting up alerts, and analyzing logs, to help you monitor the health of your systems, troubleshoot issues, and optimize performance. Datadog is widely used and integrates with a ton of different services and technologies, so we were pretty excited to test it out with Dolt.
Datadog’s MySQL integration is particularly slick. It pulls data from a variety of sources to give you a really nice view of what’s going on with your database. This data comes from querying MySQL status variables, querying MySQL’s performance_schema database, reading system variables, and looking at log files. All of these sources come together in a really nice view. Dolt doesn’t support all of these sources yet, but we recently took a first pass at the most important metrics and were able to build a nice Dolt dashboard with Datadog.
In the rest of this post we’re going to walk you through how we set up Datadog to monitor a Dolt sql-server, and how we modified our Datadog dashboard to make the default MySQL dashboard work better for Dolt.
Set up#
Before we can start making dashboards, we need to get the Datadog agent collecting metrics from a Dolt sql-server. You can sign up for a free Datadog account if you don’t have one yet. You don’t need to pay for any of the plans to try this demo out - you can use a free trial, or you can use the free tier plan after your trial ends.
In the next sections, we’ll get our Dolt sql-server running, configure it with an account for the Datadog agent to use, and then configure the Datadog agent to monitor that Dolt sql-server. These instructions come directly from the official Datadog MySQL integration documentation, so you can go dig in deeper there if you want to see instructions for setting up in another environment such as on a Docker instance or a Kubernetes environment.
Start a Dolt SQL Server#
Go ahead and install the dolt CLI if you haven’t already. Then create a directory for your Dolt database, initialize it, and start up a SQL server:
# Make sure to use this directory name, since this will be the name of your initial database, and
# the load generation script below depends on this name.
mkdir datadogTestDb && cd datadogTestDb;
dolt init

# By default, Dolt sql-server will start up on port 3306, just like MySQL,
# but if you have MySQL running on 3306 already, you can specify a port.
# Note that if you change this port, you must also update the Datadog
# configuration below and the load generation script to use the new port.
dolt sql-server --port 11234
Now that we’ve got a Dolt sql-server up and running, let’s log into a SQL session on it and configure a user for Datadog:
mysql -u root --protocol TCP --port 11234 datadogTestDb;

-- Create the user account for the datadog agent to use
-- NOTE: We use 'localhost' to only allow the agent to connect locally, but you can change this to '%' to allow remote connections
CREATE USER 'datadog'@'localhost' IDENTIFIED BY 'datadoggie';
GRANT REPLICATION CLIENT ON *.* TO 'datadog'@'localhost';
GRANT PROCESS ON *.* TO 'datadog'@'localhost';

-- NOTE: Once we have an explicitly created user, the "root" user won't be implicitly created the next time we restart
--       our sql-server, so go ahead and explicitly create a "root" user that we can keep using.
CREATE USER 'root'@'localhost' IDENTIFIED BY '';
GRANT ALL PRIVILEGES ON *.* TO 'root'@'localhost' WITH GRANT OPTION;
Finally, let’s generate some load on our sql-server so that we’ll have some data to look at when we build our dashboard. I’ve written a quick script that creates load on the database. You can grab this script from a GitHub gist, and run it locally to generate load on your database, too. Leave this running in the background while we configure Datadog to collect metrics.
./generateDatabaseLoad.shConfigure the Datadog Agent#
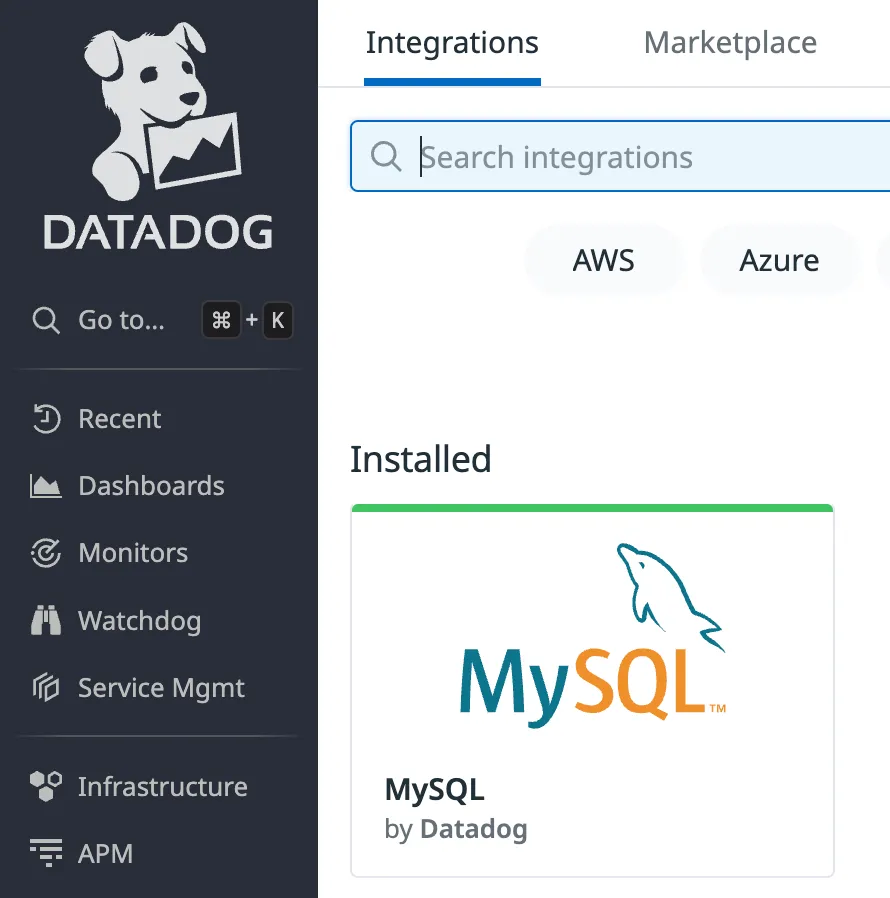
Before the Datadog agent will collect MySQL metrics, you’ll need to enable the MySQL integration. You can visit the integrations page for your account on the Datadog site and see what integrations you have installed. You should see the MySQL integration there, but if not, just search for it in the search bar at top and add it to your Datadog account.
You’ll need the Datadog agent installed on the host where you’re running your Dolt sql-server. In my setup, I’m using my Macbook, and I can see that the Datadog agent is installed and running by looking at its toolbar icon in the Mac menu bar at the top of my screen.
Next we need to configure the Datadog agent to collect metrics from our Dolt sql-server. On my Mac, the Datadog MySQL configuration lives at: /opt/datadog-agent/etc/conf.d/mysql.d/conf.yaml
Open up the Datadog agent’s MySQL conf.yaml file on your system and scroll down to find the instances section and edit it to use the datadog user and password you created in the previous section, as well as setting the port for your Dolt sql-server. Here’s what mine looks like:
instances:
  ## @param host - string - optional
  ## MySQL host to connect to.
  ## NOTE: Even if the host is "localhost", the agent connects to MySQL using TCP/IP, unless you also
  ## provide a value for the sock key (below).
  - host: localhost

    ## @param username - string - optional
    ## Username used to connect to MySQL.
    username: datadog

    ## @param password - string - optional
    ## Password associated to the MySQL user.
    password: datadoggie

    ## @param port - number - optional - default: 3306
    ## Port to use when connecting to MySQL.
    port: 11234
After you change those settings, you can go up to the Datadog icon on the system bar and select “Restart” from the context menu to speed up your changes getting picked up.
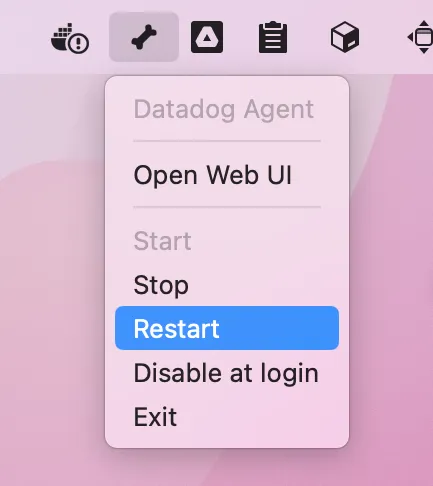
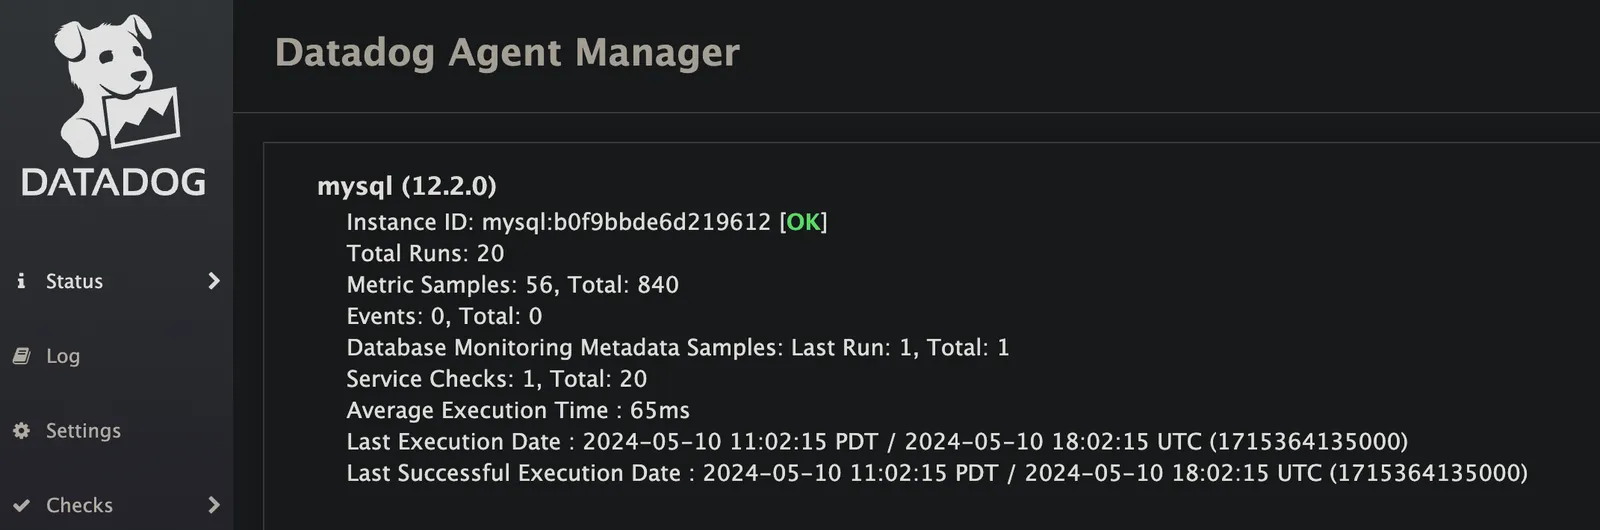
Then go back and click on “Open Web UI” menu item in the Datadog agent’s toolbar menu. This opens up a web page that shows you the status of the Datadog agent. On the left side of the page, open the “Status” → “Collector” item and scroll down to check out the status for the MySQL integration. You should see a green “OK” status there, along with some metadata about the last run. If you don’t see “OK”, check out the details to see what error the agent is reporting and see if you need to correct any of your configuration.
Dolt Dashboard#
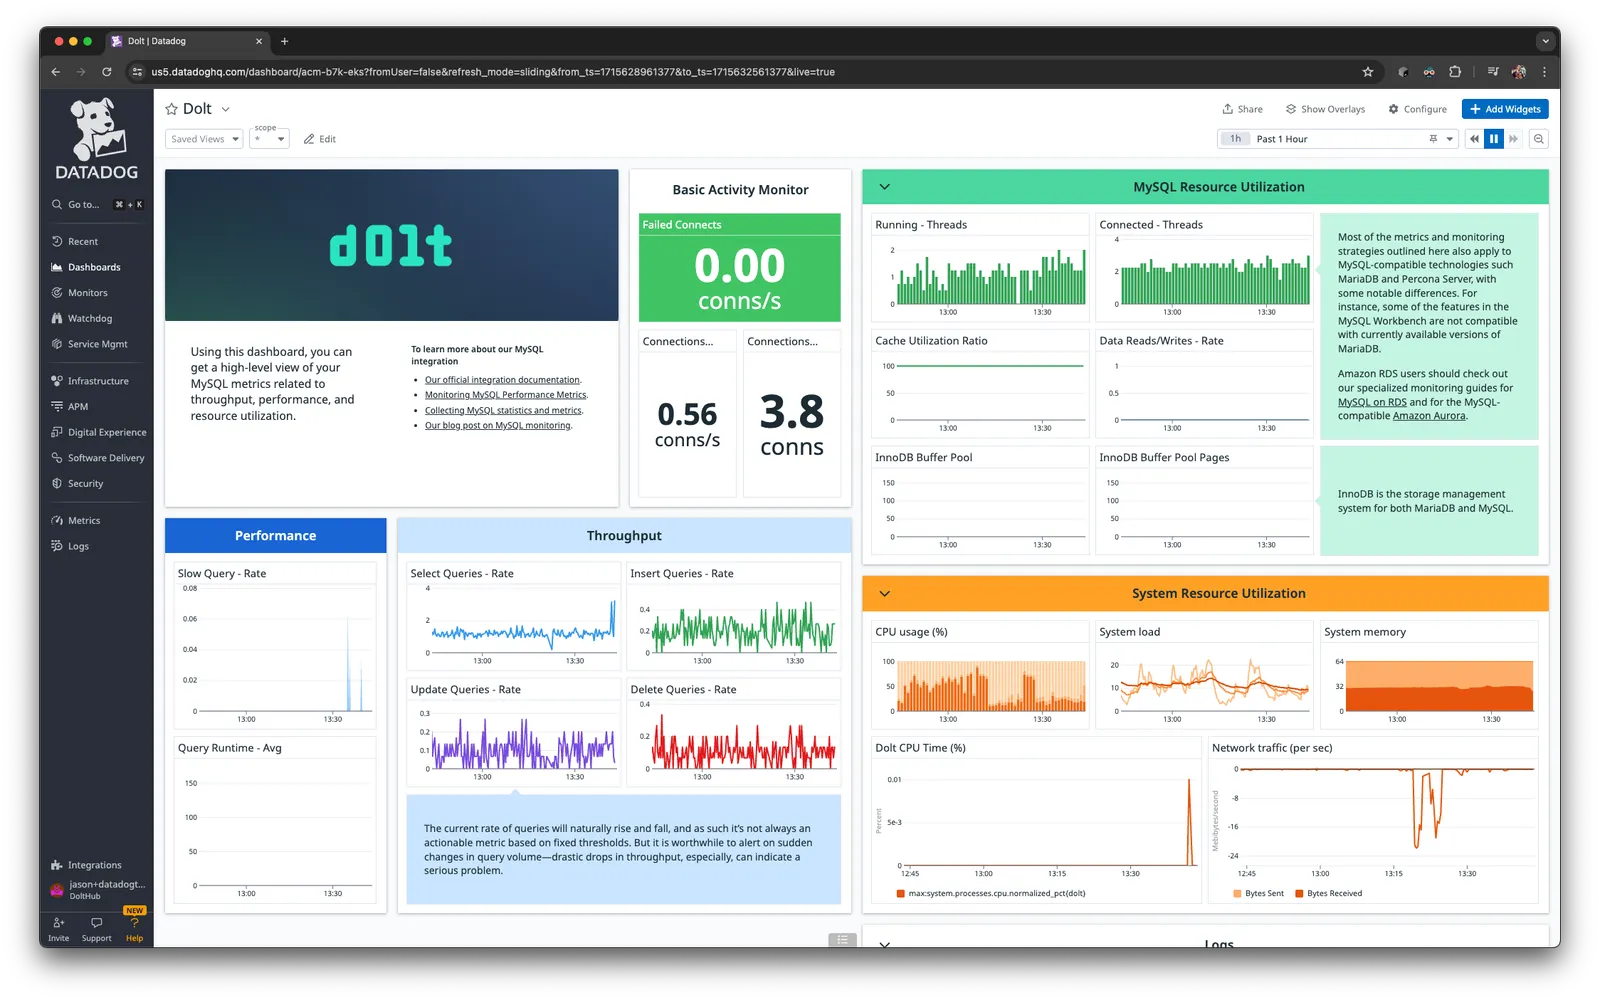
Now that we’ve got data flowing from Dolt through the Datadog agent, let’s create a Dolt dashboard!
Go to the Dashboards page in your Datadog account and you should see a dashboard called “MySQL” that was added for you automatically when you enabled the MySQL integration. Click on that dashboard and then hit the “Clone” button in the top right corner of the page. In the pop-up dialog, name the new dashboard “Dolt” and hit the “Clone” button to complete.
Now we’ve got a new dashboard that we can customize to work with our Dolt sql-server. First things first, we gotta swap out that MySQL image for a Dolt image! Definitely the most important thing to take care of first. Click on the “edit” icon for the image in the top right corner of the MySQL image, and paste in the link below for the Dolt image:
https://dolthub.com/docs/~gitbook/image?url=https:%2F%2F1372377717-files.gitbook.io%2F%7E%2Ffiles%2Fv0%2Fb%2Fgitbook-x-prod.appspot.com%2Fo%2Fspaces%252F-MO3iUAEaFtCYE0joxfA%252Fuploads%252Fgit-blob-0db185c07062a7005e70c2b3cec66d38b938b4e0%252Fdolt-preview.png%3Falt=media&width=768&dpr=1&quality=100&sign=3b29795bc71231987d7de56f475012bad9accdb59df8e2900ab755aa01fc35c5That looks much better already. Now let’s actually configure some data…
Connection Metrics#
Some of the most important high-level metrics you’ll want to monitor are around the connections to your Dolt SQL server. For example, if you’re running low on available connections, you’ll need to figure out why your application is taking up too many connections, or if you need to configure a larger max_connections setting on your database.
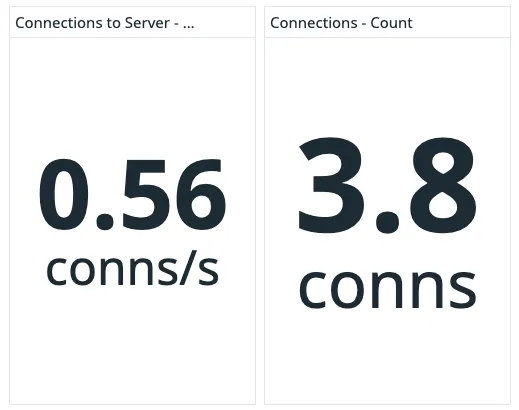
At the top of the dashboard, in the Basic Activity Monitor section, you’ll see a few metrics displayed for “Failed Connects”, “Connections to Server - Rate”, and “Connections - Count”. “Failed Connections” is not reported by Dolt yet – feel free to send us a GitHub issue and we’d be happy to implement it! “Connections to Server - Rate” comes from the Connections status variable and shows you how many new connections to your database are being established each second. “Connections - Count” comes from the Max_used_connections status variable and shows you the maximum number of connections that have been established on the server at the same time. The count here is displayed as an average over time, which is why it can show a fractional value.
The mysql.net.max_connections_available Datadog metric is another good one you might consider adding to your dashboard. It comes from the @@max_connections system variable (yup, this one is a system variable, not a status variable), and shows you the maximum number of connections your server is configured to allow.
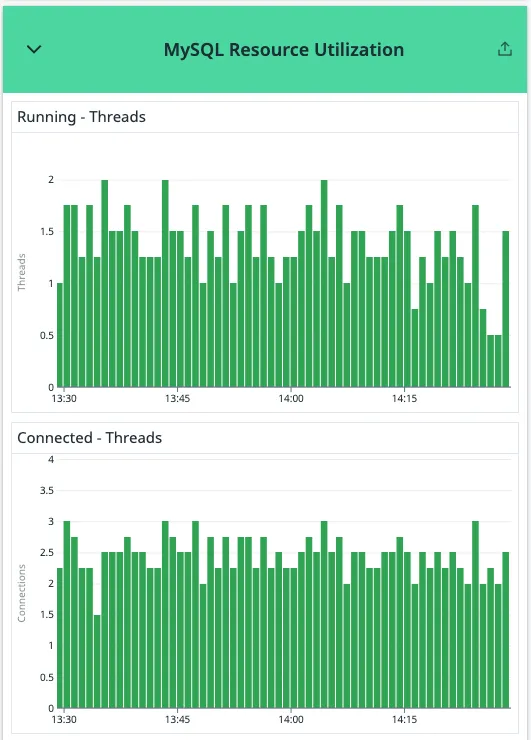
Further down, in the “MySQL Resource Utilization” section of the dashboard, you’ll see charts for “Running - Threads” and “Connected - Threads”. The running threads indicates how many connections are actively running queries, and the connected threads graph shows how many total connections are open. “Running Threads” comes from the Threads_running status variable, and “Connected Threads” comes from the Threads_connected status variable if you want to query them directly.
Throughput#
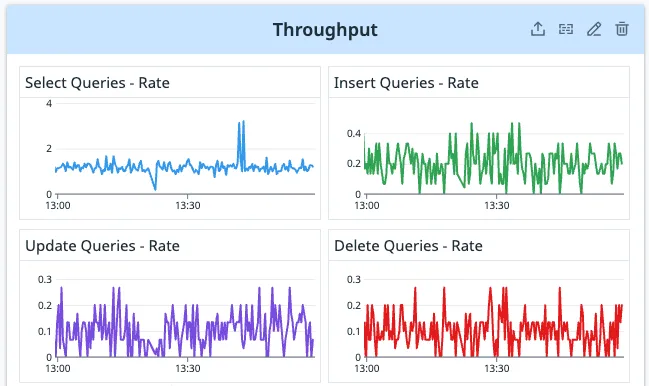
The throughput section shows you the rate of various types of statements being processed by your Dolt sql-server. The default dashboard shows the rates for select queries, insert queries, update queries, and delete queries. This data is accessed from the status variables: Com_select, Com_insert, Com_update, and Com_delete. The default dashboard shows these as a rate per second, but all of this is configurable in the dashboard editor. For example, you could configure the graphs to show the raw total numbers.
System Resource Metrics#
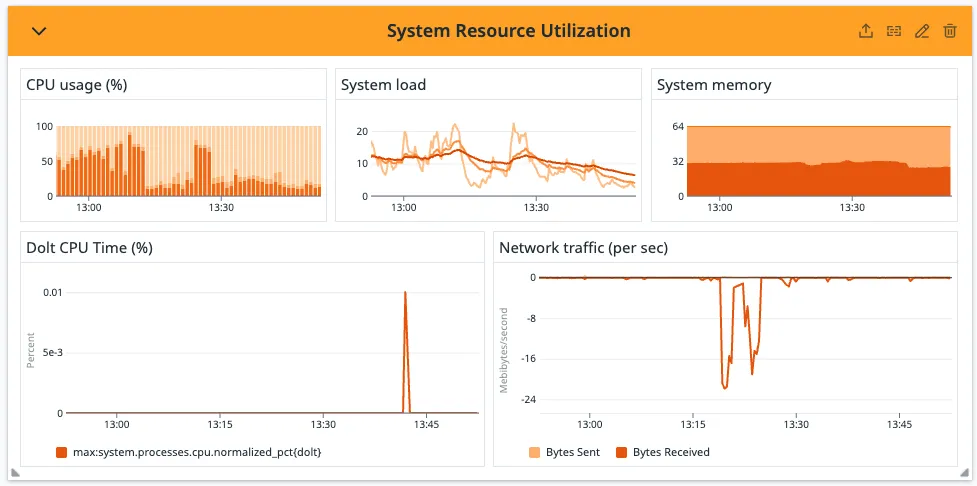
If you scroll down on the dashboard, you’ll see the “System Resource Utilization” section. This dashboard section is pre-populated with several graphs showing your system’s CPU, memory, and network activity. There’s also a graph showing kernel time data for the mysqld process. Let’s swap that out with a graph showing CPU usage for the dolt sql-server process instead. Datadog makes this really easy to do using the Processes integration.
The Processes integration is enabled by default, but there is no default configuration, so it’s not actually collecting any data until we configure it. Let’s start by copying the sample configuration and editing it to monitor our Dolt sql-server processes. On my Mac, I ran:
cp /opt/datadog-agent/etc/conf.d/process.d/conf.yaml.example /opt/datadog-agent/etc/conf.d/process.d/conf.yamlI edited the instances section in the conf.yaml file that we just copied to look like this:
## Every instance is scheduled independently of the others.
instances:
  ## @param name - string - required
  ## Used to uniquely identify your metrics as they are tagged with this name in Datadog.
  - name: dolt

    ## @param search_string - list of strings - optional
    ## If one of the elements in the list matches, it return the count of
    ## all the processes that match the string exactly by default. Change this behavior with the
    ## parameter `exact_match: false`.
    ##
    ## Note: Exactly one of search_string, pid or pid_file must be specified per instance.
    search_string:
      - dolt sql-server

    ## @param exact_match - boolean - optional - default: true
    ## If you want to match your `search_string` on a substring within the list of process names,
    ## set this to true. This is equivalent to running `ps -e` on Linux or `Get-Process` on Windows.
    ##
    ## If you want to match your `search_string` on a substring within the list of process names
    ## and the command line, set this to false. This is equivalent to running `ps -ef` on Linux or
    ## `Get-CimInstance Win32_Process | select name,commandline` on Windows.
    ##
    ## Regex is also supported when this flag is set to `false`.
    ##
    ## Note: agent v6.11+ on windows runs as an unprivileged `ddagentuser` that does not have access to the full
    ## command line of processes running under a different user. This option cannot be used in such cases.
    ## https://docs.datadoghq.com/integrations/process/#configuration
    exact_match: false
If you scroll down further in the Processes conf.yaml file, you’ll see a lot more settings, such as where you can configure alarms on process metrics, but we won’t go into that today.
After you update that config, don’t forget to restart the Datadog agent from the toolbar icon.
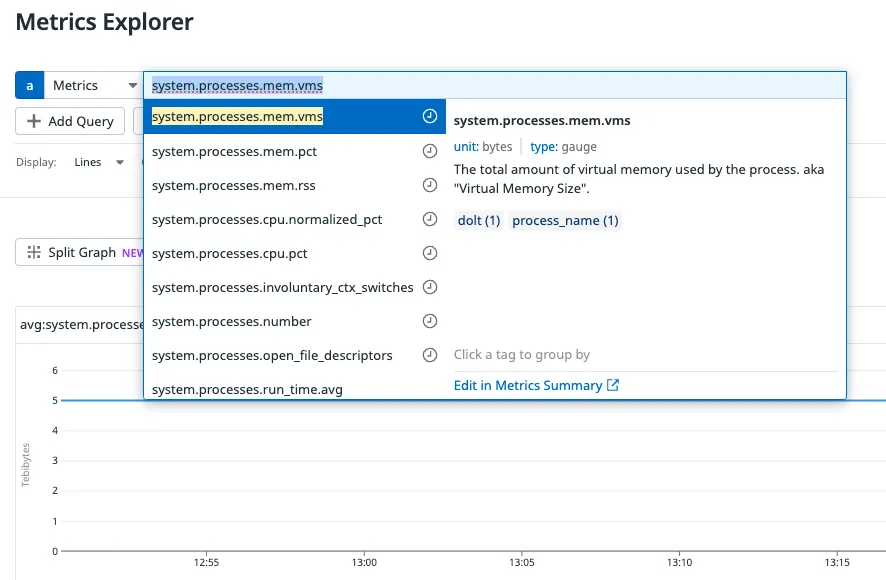
Using the Metrics Explorer in the Datadog UI is a great way to explore what metrics are being reported before you add them to your dashboard. If you search for “system.processes” you can find all the metrics being reported by the Processes integration. After a few minutes of collecting data, you should see several process metrics for your running dolt sql-server processes. The most important metrics to watch for a Dolt sql-server are system.processes.cpu.normalized_pct to give you an idea of the CPU utilization and system.processes.mem.vms to show you how much memory the Dolt server is using.
Now that we’ve got process level metrics being reported for our dolt sql-server processes, let’s update our dashboard to show them, instead of the mysqld process data. Scroll down to find the “MySQL CPU Time (%)” graph at the bottom of the dashboard and hit the edit button for that block in the dashboard. We’re going to change this to show the normalized CPU utilization percent for the Dolt sql-server processes by making the following changes:
- Set the
metricto:system.processes.cpu.normalized_pctand optionally, setdoltas the tag in thefrombox (this is only needed if you have multiple process groups you’re monitoring) - Set the Graph Title to:
Dolt sql-server CPU Usage (%)
Slow Query Metrics#
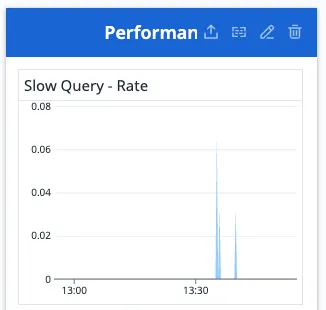
One of the nice query analysis features that MySQL provides is the slow query log. This log includes information for any queries that execute longer than @@long_query_time seconds. It’s a handy way to identify queries that aren’t executing efficiently and probably need some tuning. Dolt doesn’t write out a log with slow query information yet, but it does keep a count of how many queries are taking longer than @@long_query_time to complete. This data is exposed through the Slow_queries status variable and is shown already in our Datadog dashboard.
An easy way to test out the slow query metrics is to run a query like SELECT SLEEP(13);. That statement will execute in 13s, which is longer than the 10s default of @@long_query_time, so it will get recorded as a slow query, and you’ll see a blip in your slow query rate graph like you see below.
btw… if you’re interested in a slow query log for Dolt, let us know by up-voting or commenting on the open feature request on GitHub. We think this would be a pretty neat feature to have in Dolt, and we’d be happy to build it out for any customer who needs it.
Wrap Up#
Datadog provides powerful and easy to use metrics collection, dashboarding, and alarming. Since Dolt is compatible with MySQL, it’s easy to use Datadog’s existing MySQL support to monitor your Dolt sql-server instances. The Datadog MySQL integration pulls data from status variables, log files, and system level metrics. We’ve instrumented support for some of the most important status variables, and we’re happy to add more metrics if there are any that you’d like to use. Just shoot us an issue on GitHub to let us know what you need, or drop by our Discord and let us know what you’re trying to get working and we’ll be happy to help out.