Dolt is the first and only database that versions structured data the way Git versions code. Our users use Dolt either as a relational database running on cloud hardware, like Hosted Dolt, or as a web collaboration tool like DoltHub or Doltlab backed by a cloud filesystem. All of these applications share the common Dolt software. But the storage systems they use to read and write data vary in important ways.
Background#
Most database servers use solid state drives (SSD) these days. It is the default in most laptops and cloud compute instances because it is fast, light, consistent, and increasingly cheap. SSDs are forgiving for application developers because performance depends less on access patterns.
Cloud file systems are less forgiving. Reading and writing from an S3 bucket, for example, has stricter network and bandwidth limitations. Requests to S3 can be slow over the network, >10ms end to end vs .2ms to a local SSD. And files are usually read in megabyte blocks, rather than kilobyte blocks on a local filesystem.
Network and bandwidth restrictions change the optimal ways to execute certain SQL queries. For example, the join planner often favors lookup joins for local filesystems. We have fine control over reading individual 16kb pages from disk and can often complete a join only reading a fraction of the table. But reading a row from an S3-backed table might require reading a megabyte plus sized file with an expensive network round trip. The latency of performing a few lookups quickly outpaces the cost of bulk reading the whole table into a hash map in memory.
A new user with a redundant array of inexpensive disks (RAID) contacted us recently on our Discord with performance problems. A RAID is an abstracted group of hard disk drives (HDD), and we did most of our performance testing here on a single AWS st1. The customer’s 1.6TB database imported in a matter of hours, but other operations, especially an index build, were running for days.
The lesson from cloud filesystems will be the same for disks, avoid small random reads! But albeit for different architectural reasons. A single head on a spinning disk incurs seek latency of about 10ms in our testing. We can compare disk seek latency to network latency for non-contiguous reads from S3. And while we have a special application chunk store that considers network latency for cloud storage, HDDs use our local filesystem interface. Our RAID user found several Dolt storage issues that SSD’s forgiveness hid for years.
Slow Tablescans#
Tablescans read a whole table from the smallest to largest key. This is normally done in-order because, why would you do it in any other way? In-order makes state tracking easy and agrees with the architecture of HDDs and cloud filesystems. So it was a bit of a surprise to find Dolt was not performing tablescans in order! We just didn’t notice because SSDs treat random and sequential IO the same, and all our users so far have SSDs.
Here is a layer of our ReadMany:
func (ns nodeStore) ReadMany(ctx context.Context, addrs hash.HashSlice) ([]Node, error) {
	found := make(map[hash.Hash]Node)
	gets := hash.HashSet{}

	for _, r := range addrs {
		n, ok := ns.cache.get(r)
		if ok {
			found[r] = n
		} else {
			gets.Insert(r)
		}
	}
The list of addresses are content hashes to Prolly
tree
leaf records. Each record contains a batch of rows. Loading records into
the gets hash map after filtering for cached records discards
ordering.
Here is what that looks like in practice:
> select count(hostname) from dns;

time                chnk  avg lat
...
2024/04/11 18:52:28 28455 10.730381303813038
2024/04/11 18:52:39 29403 10.752270176512601
2024/04/11 18:52:39 29411 10.756145659787155
2024/04/11 18:52:40 29913 10.622906428643065
...
+-----------------+
| count(hostname) |
+-----------------+
| 1000000         |
+-----------------+
Reading individual record takes about 10.7ms per record. One disk seek per record!
We now sort reads at a lower
level of the storage interface for the local filesystem. Records are read at increasing
offsets in the linear journal file, so each ReadMany requires at most one disk seek:
	var jReqs []journalRecord
	for i, r := range reqs {
		rang := s.journal.ranges.get(*r.a)
		jReqs = append(jReqs, journalRecord{r: rang, idx: i})
	}

	// sort chunks by journal locality
	sort.Slice(jReqs, func(i, j int) bool {
		return jReqs[i].r.Offset < jReqs[j].r.Offset
	})
We see the latency normalize to .2ms per record without the disk seek penality:
> select count(hostname) from dns;

time                chnk  avg lat
...
2024/04/11 18:57:20 29600 0.21733108108108107
2024/04/11 18:57:20 29700 0.2175084175084175
2024/04/11 18:57:20 29800 0.21751677852348994
2024/04/11 18:57:20 29900 0.21722408026755852
...
+-----------------+
| count(hostname) |
+-----------------+
| 1000000         |
+-----------------+
Disk seek latency sucks! But our read planning is getting better.
Slow Index Builds#
The same customer had a slightly different issue with same root cause. Building secondary indexes requires reading all of the rows from the primary index (with a tablescan), selecting the fields from each row that comprise our secondary index key, and then writing the secondary keys into a new index. The core loop is pretty concise:
	for {
		k, v, err := primaryIter.Next(ctx)
		if err == io.EOF {
			break
		} else if err != nil {
			return nil, err
		}

		idxKey, err := secondaryBld.SecondaryKeyFromRow(ctx, k, v)
		if err != nil {
			return nil, err
		}
		if err = secondaryMap.Put(ctx, idxKey, val.EmptyTuple); err != nil {
			return nil, err
		}
	}
Even after fixing the tablescan, the HDD backed filesystem executes this slowly. We build 1 million rows in 19 seconds, and 3 million rows in 15 minutes. The read latency for the out of memory build is the same story as before.
So how is ALTER TABLE <table> ADD INDEX paying a disk seek penalty?
Rematerialize Index Every Batch#
First a bit of background. A secondary index that is not a redundant
partial key of the primary index will generate keys in an unsorted order.
So secondaryMap.Put collects a batch of unsorted keys in memory. If
batches are pair-wise sorted, then that’s great because flushes just append to the
end of the last batch. If you have more RAM than you have keys, then
everything also works great because we can sort everything in memory and
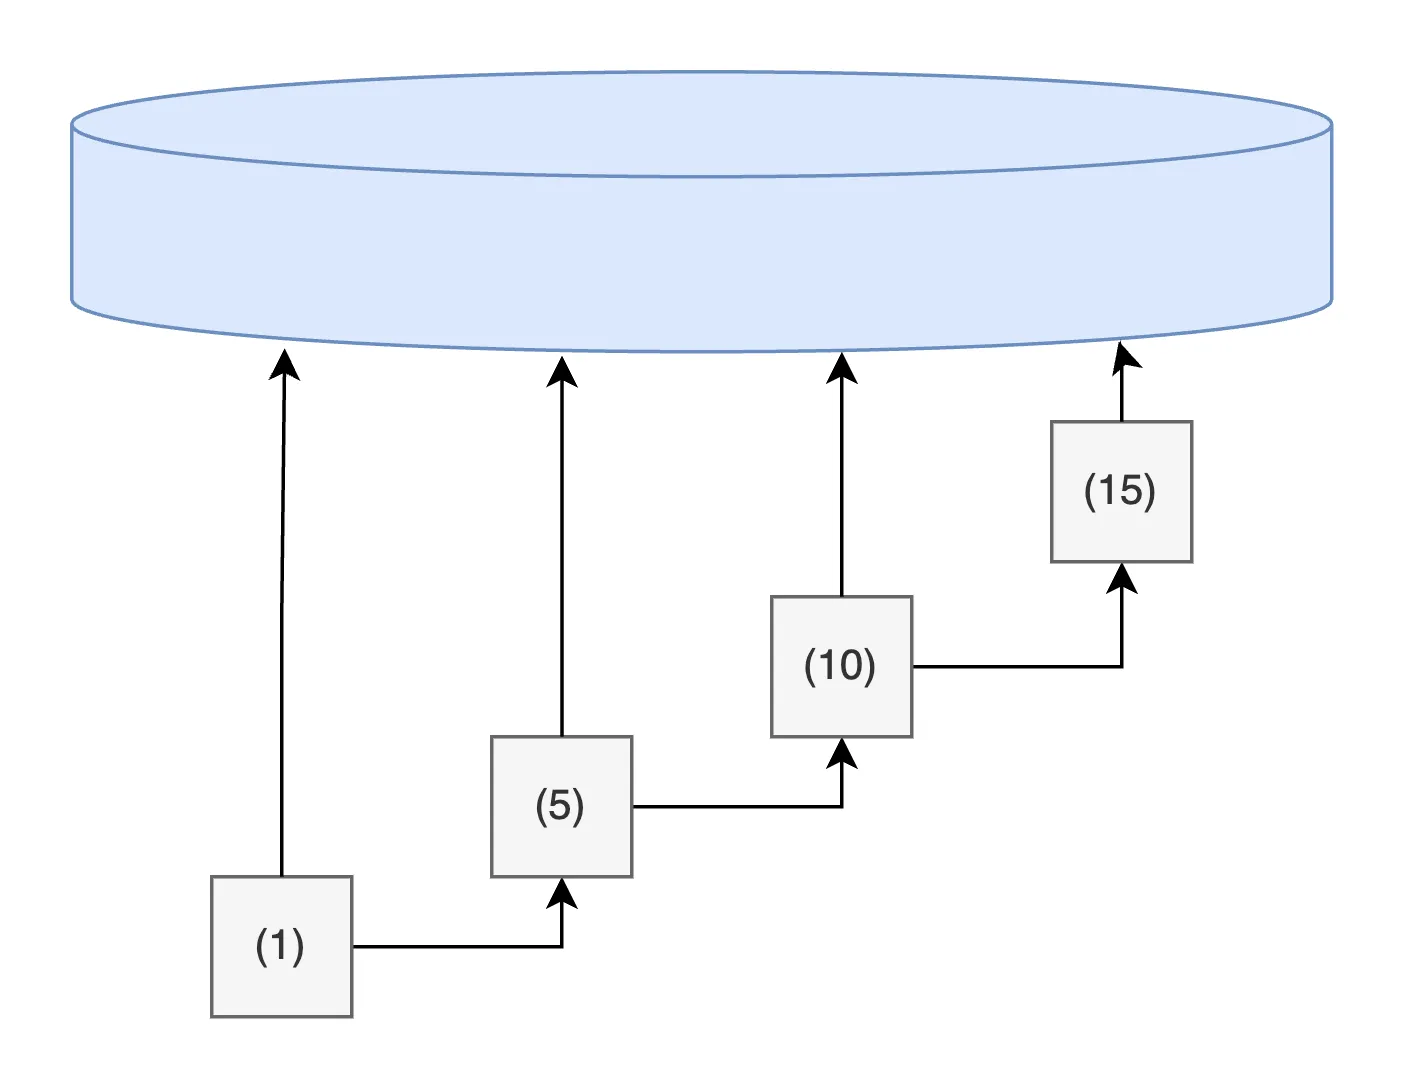
write once at the end. Sequential inserts are diagrammed below.

But if you have 1.6 TB of unsorted keys and less RAM, like our RAID customer, you’ll need to swap the intermediate results to disk.
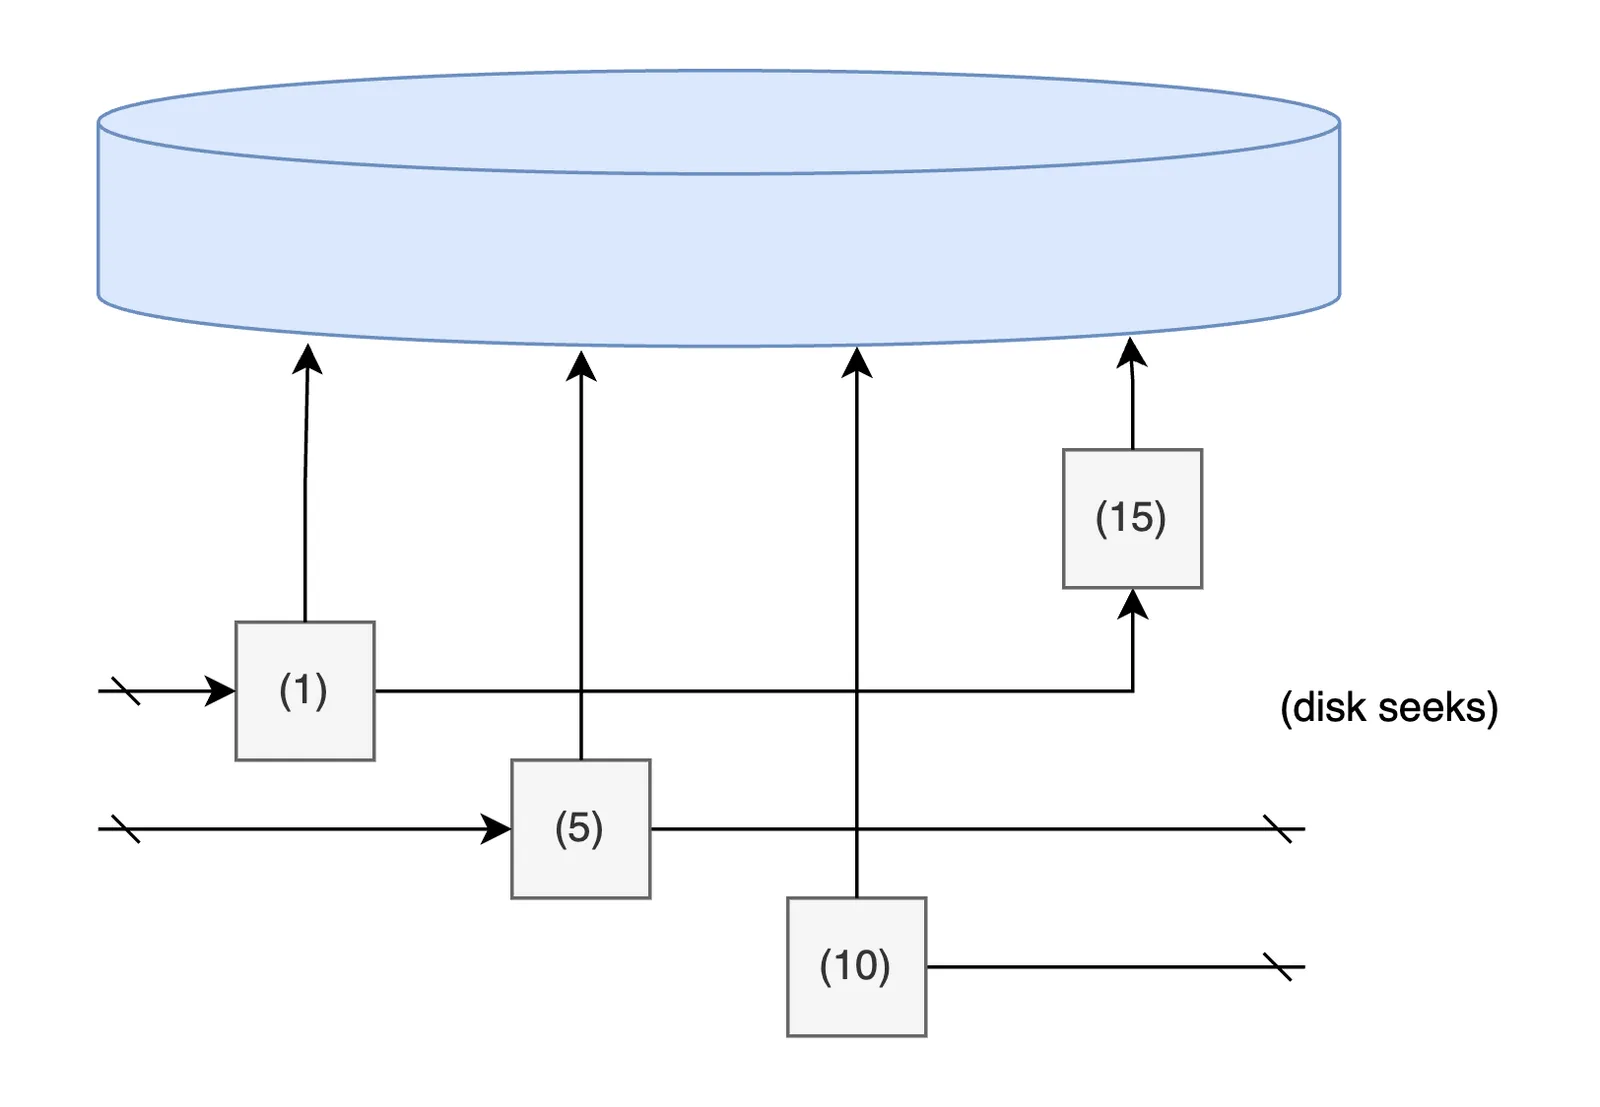
The way Dolt used to flush batched memory edits was to materialize Prolly trees. So every flush is equivalent to a big INSERT statement. The first flush is easy because we append keys to an empty tree. But the second batch onwards with unsorted keys are more complicated. Batch inserts into a large tree are basically random writes. Even if the batch is sorted, each key is inserted at random points into the preexisting tree. The writes aren’t expensive, but discovering the position to write each key is. This should start ringing some alarm bells. Random reads are the thing we were trying to avoid. The diagram below shows how a seek performs a full disk rotation to reach the next insert point.

So mathematically, a sorted index build will perform n*seq_write IOs.
An unsorted index build that can fit in memory will also perform n*seq_write IOs.
But an out of memory unsorted index build will be more like n*(rand_read + seq_write)
IOs. We can’t completely remove the read cost, we still need to move
keys on and off disk for sorting reasons. But we can convert the random
reads to sequential reads: n*(seq_read+seq_write).
External Merge Sorting#
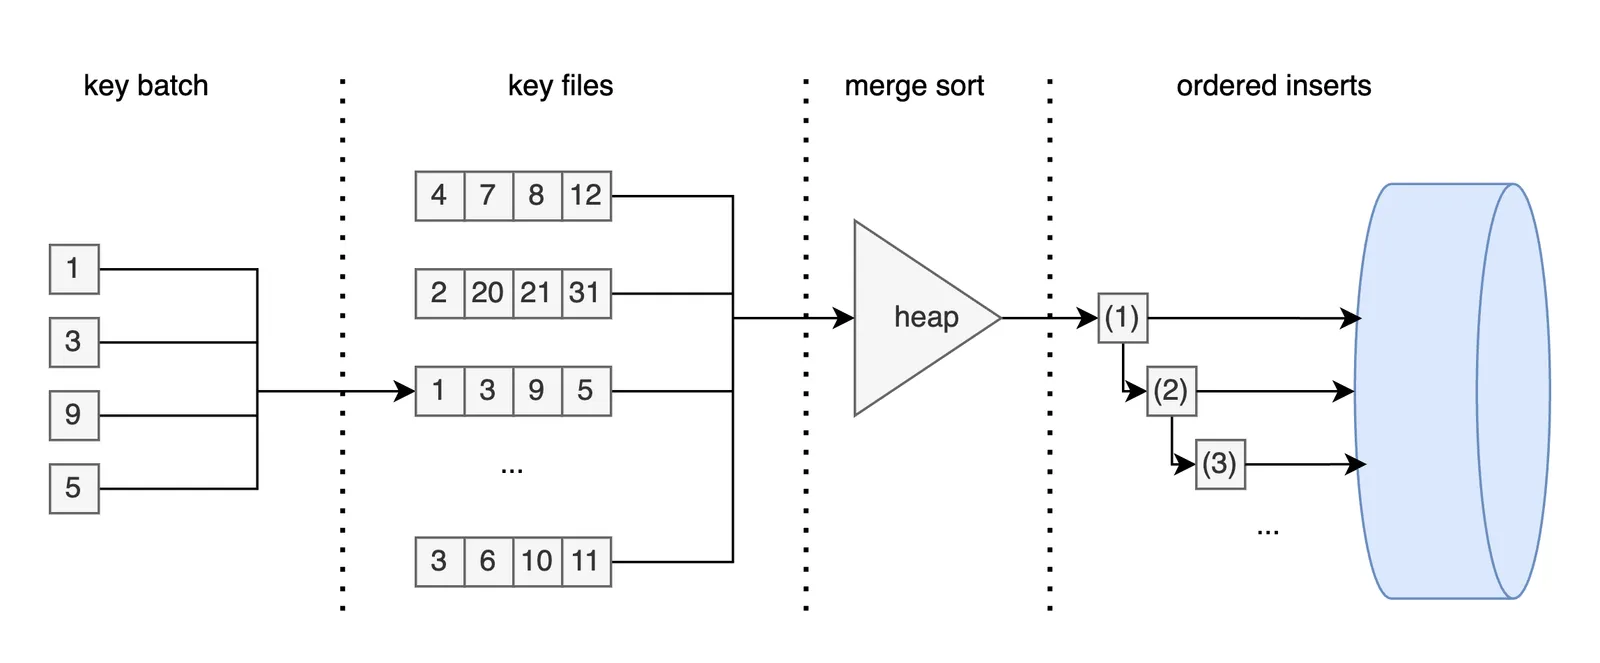
Instead of materializing key batches into formal Prolly trees, we write files of sorted runs to disk. Sized-tiers of files can be flattened to limit the file count. At the end, a final merge k-way generates sorted keys that feed into the index build. Each of these steps uses sequential IO to sort keys so that we can hide the disk seek latency.
The diagram below summarizes the process, moving from unsorted keys, to key files, to a merge sorted list of sequential inserts into the new index.

Building an index of 1 million rows with sequential latency of ~.2ms and random latency ~10ms takes ~170 minutes before, and ~3 minutes after.
| rows (million) | Prolly inserts | external sorting | difference |
|---|---|---|---|
| 1 | 19 seconds | 18 seconds | -5% |
| 3 | 15 minutes | 1 minute | -93% |
| 10 | 280 minutes | 4 minutes | -99% |
More details are in the pull request here.
Summary#
We spent the last couple years improving query transformations to streamline execution. At the beginning of this year we added table specific statistics to optimize queries based on the shape of individual datasets. And now we’re getting better at considering storage architecture and operating system execution dynamics.
If you have any questions about Dolt, databases, or Golang performance reach out to us on Twitter, Discord, and GitHub!